
INTRODUCTION DATA HANDLING AND ANALYSIS
"Introduction to Data Handling, Analysis, and Inferential Testing in Psychology"
Understanding data is crucial in psychology to make sense of human behaviour and mental processes. This involves organising, analysing, and interpreting data to draw meaningful conclusions. Data handling includes descriptive statistics like measures of central tendency (mean, median, mode) and dispersion (range, standard deviation).
Inferential testing, on the other hand, helps psychologists determine whether results are due to chance or a real effect. Key topics include hypothesis testing, probability levels, significance, and the selection of appropriate statistical tests (e.g., chi-square, Mann-Whitney, or Spearman's rank). This process ensures psychological research remains scientific and credible.
QUANTITATIVE AND QUALITATIVE DATA
Explore the basics of data, including qualitative and quantitative data, and understand the distinction between qualitative and quantitative data collection techniques. Learn how qualitative data captures meaning and depth, while quantitative data focuses on numerical measurement and analysis, forming the foundation of psychological research and data handling

DESCRIPTIVE STATISTICS
Descriptive statistics: measures of central tendency (mean, median, mode) and measures of dispersion (range and standard deviation). Includes calculations, percentages,
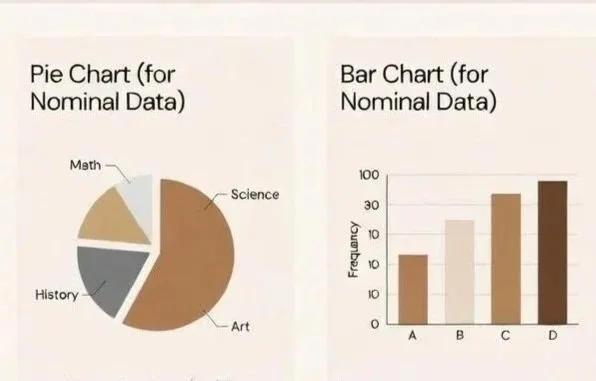
GRAPHS, TABLES, SCATTERGRAMS, AND BAR CHARTS.
Presentation and display of quantitative data: graphs, tables, scattergrams, bar charts and histograms. Essential topic for A-level psychology data handling and analysis.
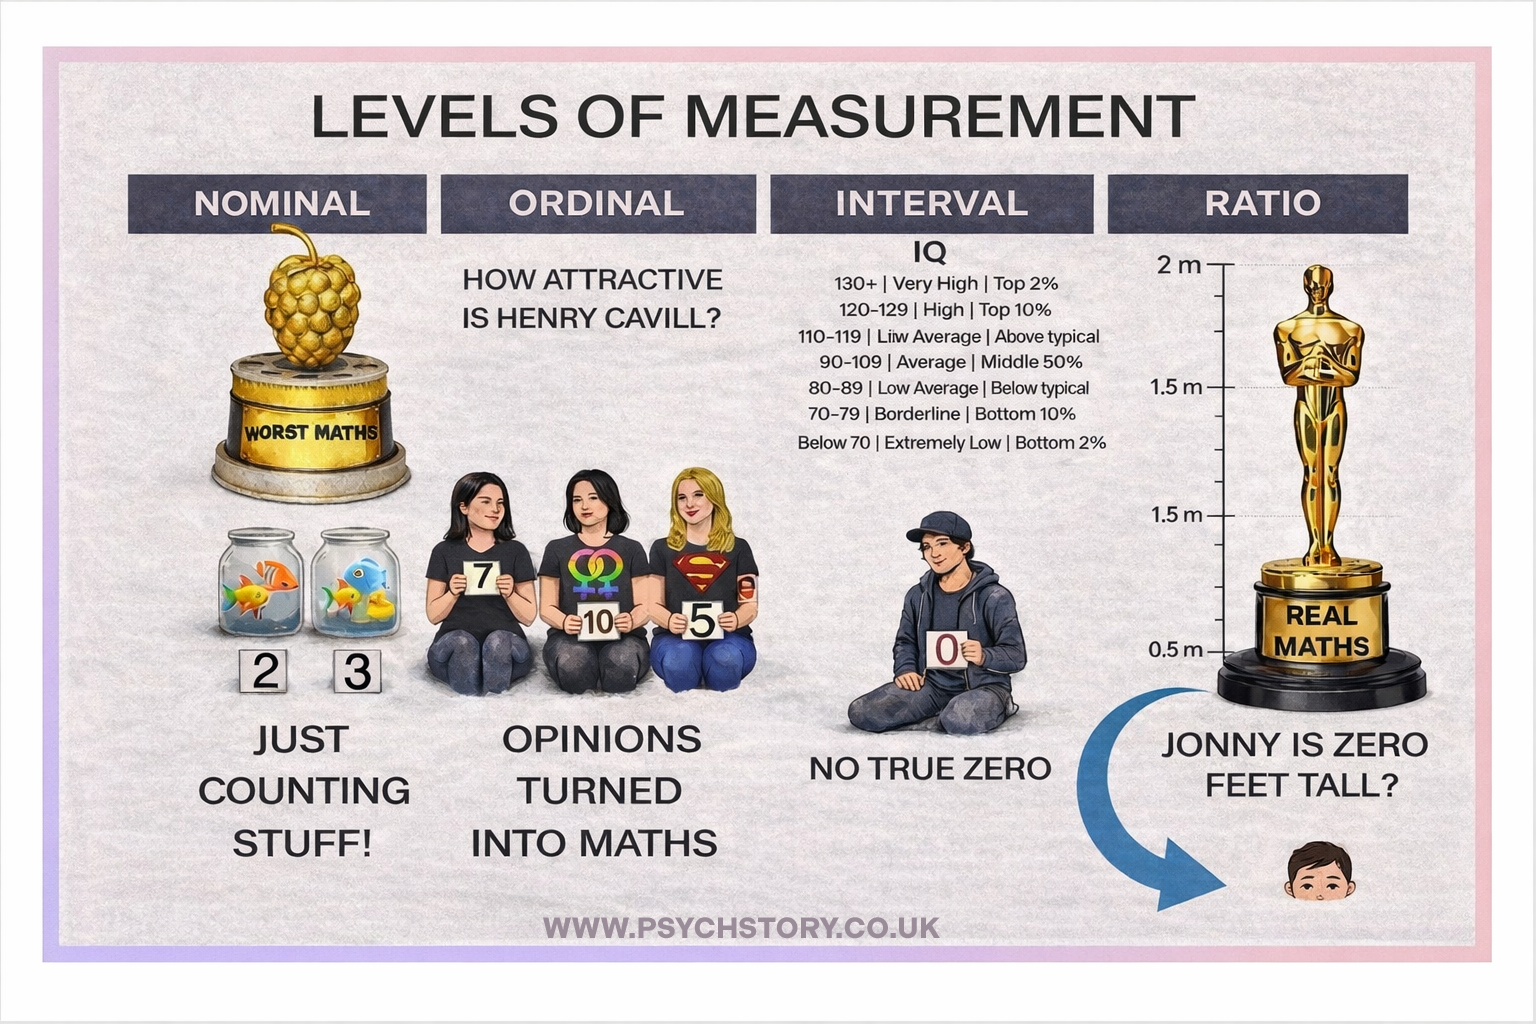
LEVELS OF MEASUREMENT
Levels of measurement: nominal, ordinal, interval, and ratio data. What they actually mean, how to recognise them in exam questions, and why they determine the statistics you can and cannot use, with clear AQA-focused examples.
PRIMARY AND SECONDARY DATA, INCLUDING META-ANALYSIS
Primary and secondary data in psychology, including meta-analysis. Evaluation of their strengths and limitations for A-level research methods and data handling.
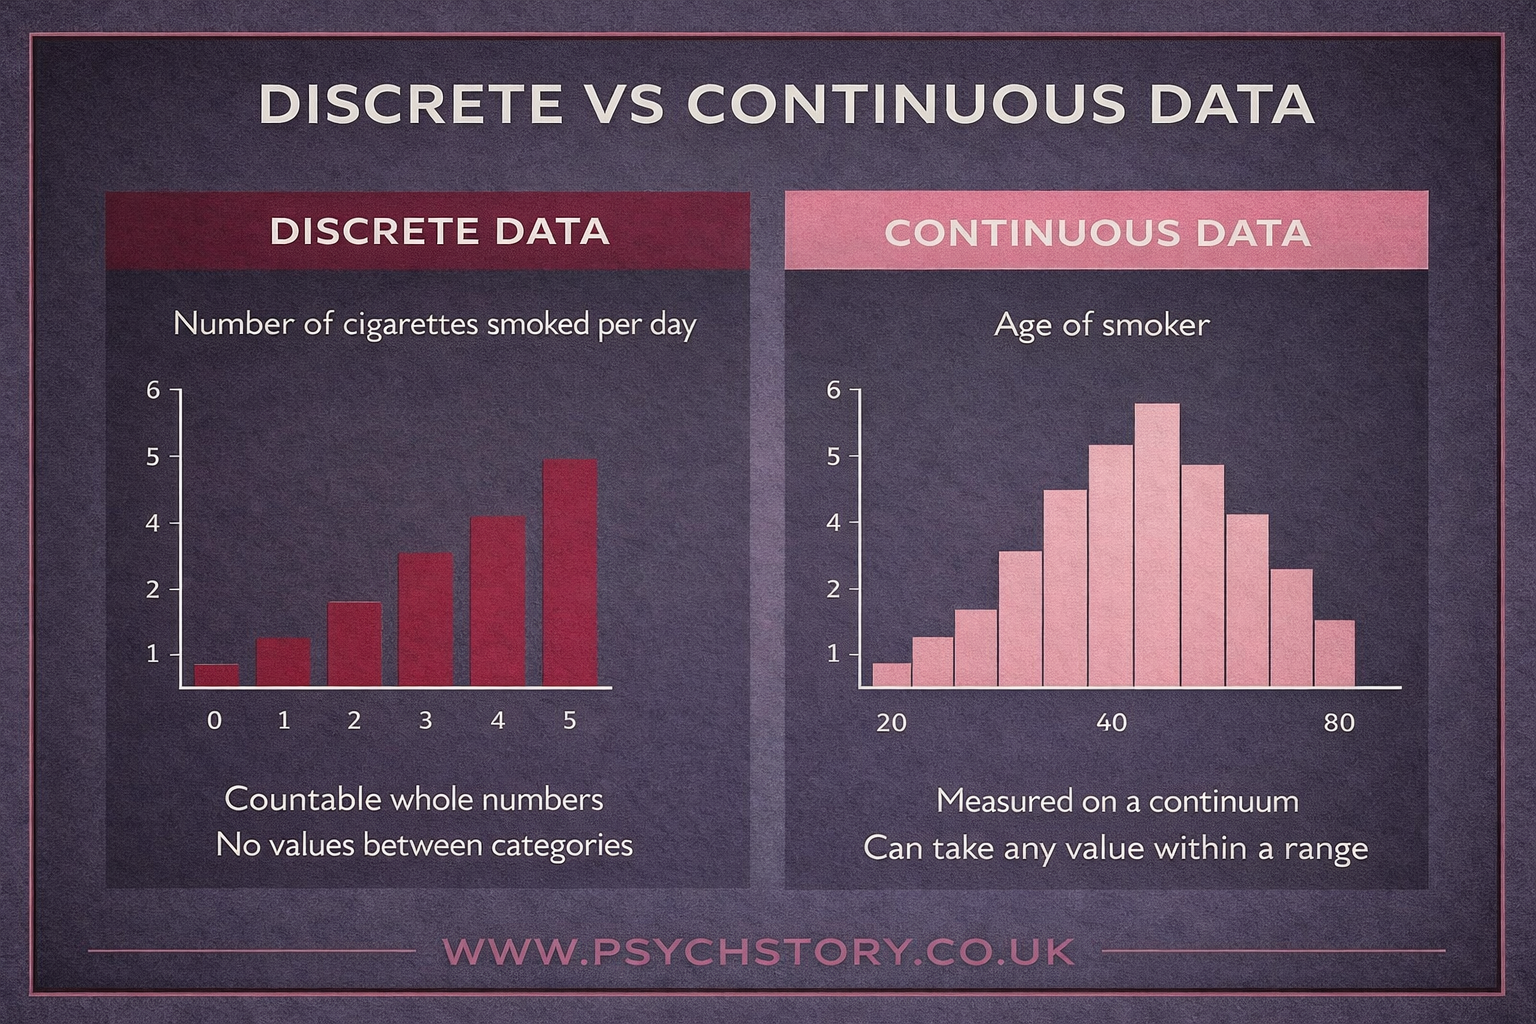
DISCRETE AND CONTINUOUS DATA
CONTINUOUS AND CATEGORICAL DATA
Data in psychology can be categorised as continuous or categorical (also called discrete). Continuous data refers to numerical values that can take any value within a range, such as height, weight, or reaction time. It is measured on a scale and often analysed using means or standard deviations.
Categorical data, on the other hand, involves distinct categories or groups. Examples include gender, ethnicity, or types of therapy. This data is non-numerical and is often summarised using frequencies or percentages.
Understanding the distinction is key to choosing the right statistical tests and interpreting psychological research effectively.