
POSITIVE, NEGATIVE AND ZERO CORRELATIONS.
SPECIFICATION: Correlations. Analysis of the relationship between co-variables. The difference between correlations and experiments. Postive, negative and zero correlations.
CORRELATION TERMINOLOGY AND LANGUAGE
Correlation is often described using everyday language that reflects association rather than cause. Common synonymous terms include link, relationship, association, connection, or pattern. All of these refer to the same core idea: two measures vary together in some way.
In correlation, the variables are not described as independent variables (IVs) or dependent variables (DVs), because no variable is being manipulated and no causal direction is assumed. Instead, both are referred to as co-variables. This reflects the fact that each variable is simply measured, and the analysis examines how they relate to one another.
For example, age and memory score, hours of sleep and reaction time, or stress level and illness frequency are all pairs of co-variables. The terminology is deliberately neutral, avoiding causal language such as “effect” or “influence.”
This distinction is essential. Correlation identifies relationships, not cause and effect.
CORRELATIONS: ANALYSIS OF THE RELATIONSHIP BETWEEN CO-VARIABLES
WHAT IS CORRELATION?
Correlation is a statistical technique that measures the relationship between two variables. It shows the extent to which the values of one variable are associated with those of another. In practice, this means correlation reveals whether two things tend to vary together in a systematic way. For example, researchers might examine whether the number of hours adolescents spend playing violent video games is associated with higher levels of aggressive behaviour, or whether people who score higher on a measure of anxiety also tend to report poorer sleep quality. The technique does not simply note that two variables are related; it quantifies the strength and direction of that relationship using statistical methods. A strong correlation indicates that the two variables move together consistently, while a weak correlation suggests a much looser or barely present link.
WHY CORRELATIONS?
Correlation is never really a first-choice method when researchers want to establish a causal relationship. Correlations are used mainly when a true experiment is not possible for either practical or ethical reasons. This is especially common in psychology because studying human behaviour involves far too many variables to control effectively. Isolating a single independent variable is often impossible. Consider, for example, the study of jealousy. How could researchers create two genuinely comparable groups of participants while untangling the effects of hormones, gender, birth order, ethnicity, religion, personality, upbringing, and all the other factors that could influence levels of jealousy? Even if such control were possible, the study would almost certainly raise serious ethical problems.
For these reasons, correlation is frequently the only practical option available. In practice, psychologists often treat correlations as proxies for cause-and-effect relationships.. When two variables are closely associated, it raises the possibility that one may be causing the other. However, correlation itself does not demonstrate causation. It only indicates that a relationship exists.
Sometimes correlations arise incidentally through inductive reasoning from real-world observations. For example, doctors noticed a link between smoking and lung cancer simply by observing patterns in surgery and hospital records. At other times, correlations are used deliberately as preliminary research to test the strength of a suspected association before investing in more resource-intensive experimental studies. Only later, where ethical and practical constraints allow, might researchers attempt experimental designs to move closer to establishing causation, or triangulate findings from other non-experimental methods
Correlation derives from the Latin co, meaning together, and relatio, meaning relationship, and refers to the extent to which two variables vary together.
Correlation means relationship - more precisely, it measures the extent to which two variables are related.
THE DIFFERENCE BETWEEN CORRELATIONS AND EXPERIMENTS
NO CAUSE AND EFFECT IN CORRELATIONS
Cause and effect are the backbone of the scientific method. It drives everything from the formation of hypotheses to the drawing of conclusions in an experiment. The central purpose of the scientific method is to determine whether a specific cause produces an observed effect. A clear understanding of cause-and-effect relationships is essential for developing effective treatments, shaping sound policies, and guiding further research. Without it, conclusions risk being based on uncertain or coincidental associations, which can lead to ineffective or misguided applications in both practical and research contexts.
Cause and effect are characterised by a specific event (the cause) leading directly to another event (the effect). Establishing a true cause-and-effect relationship requires more than simply observing that two things occur together. In experimental research, it demands rigorous conditions: the researcher must actively manipulate the independent variable (IV) by creating at least two different conditions to compare, randomly assign participants to those conditions, and control all extraneous variables (EVs) so that the only systematic difference between the conditions is the IV itself. Only then can any change in the dependent variable (DV) be confidently attributed to the manipulation of the IV rather than to chance, coincidence, or other uncontrolled factors.
A clear example is the impact of sleep deprivation on cognitive performance. In well-designed experiments, researchers manipulate the IV by assigning participants to different conditions (for example, one group is kept awake for 24 hours while a control group sleeps normally), randomly allocate participants to each condition, and tightly control extraneous variables such as diet, activity levels, and time of testing. Under these conditions, lack of sleep (the cause) has been consistently shown to lead to decreased alertness and impaired memory (the effect). This demonstrates a direct causal relationship rather than a mere correlation
Confusing cause and effect with correlation is common because both can appear related in a dataset. Correlation occurs when two variables tend to change together, but it doesn't imply that one variable causes the change in the other. For instance, Hilda baked a batch of pork pies. Every time she ate one, there was a thunderbolt of lightning. It could be concluded that there is a positive correlation between lightning and pork pies, but what can't be said is that the pork pie caused the lightning, at least not without evidence to back it up. Unless scientific proof can be obtained that Hilda's pies are causing unusual weather conditions, it's just a coincidence that these lightning strikes occur when they do. This illustrates that correlation indicates a relationship or pattern between variables but does not establish a cause-and-effect link. Confusion arises because the simultaneous change in correlated variables can give the illusion of a direct causal relationship.
CAUSE AND EFFECT OR COINCIDENCE?
Consider the following statements. All of them are factually true, yet none of them demonstrates cause and effect — they are all examples of correlation:
More than 98% of convicted criminals are bread eaters.
50% of all children who grow up in bread-consuming households score below average on standardised tests.
People who own cats have higher incomes than people who own dogs.
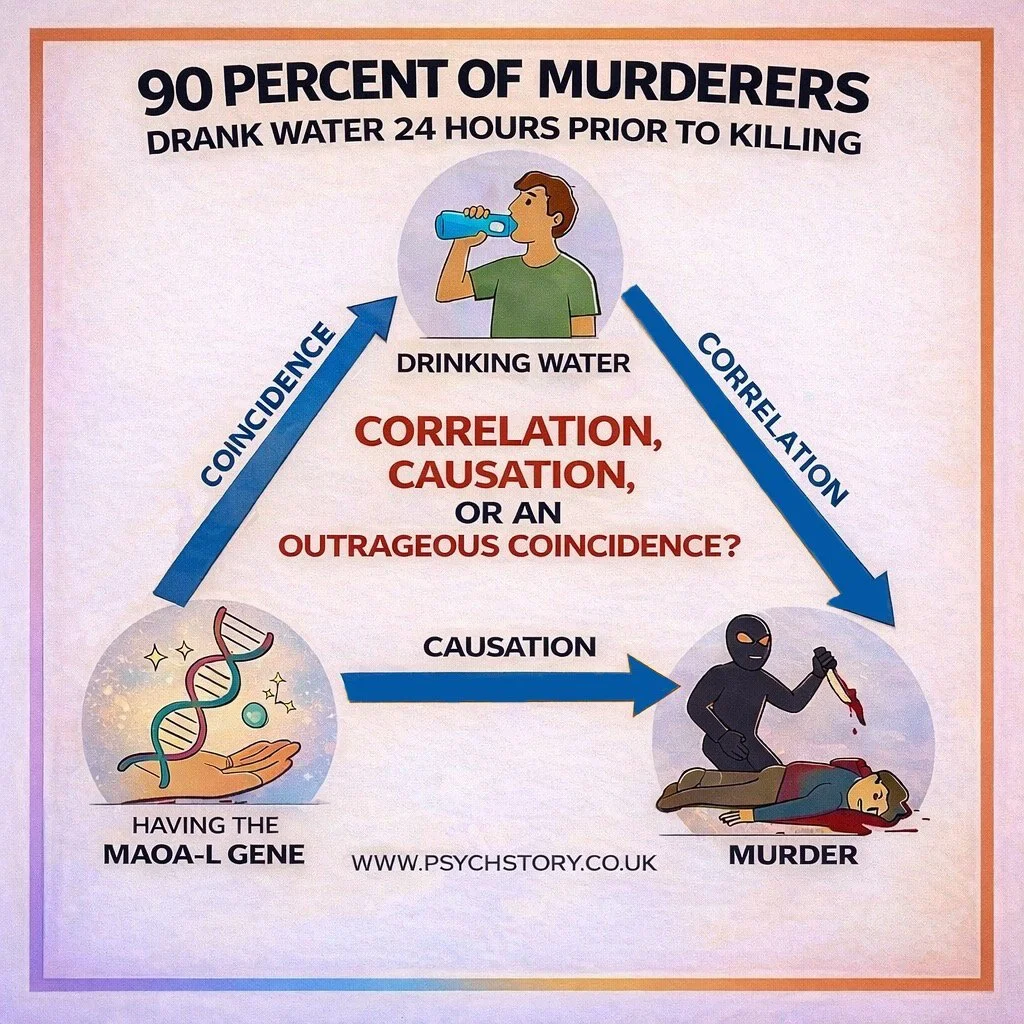
Most murderers in Scotland have a surname beginning with M.
In the 18th century, when virtually all bread was baked in the home, the average life expectancy was less than 50 years; infant mortality rates were unacceptably high; many women died in childbirth; and diseases such as typhoid, yellow fever and influenza ravaged whole nations.
Primitive tribal societies that have no bread exhibit a low occurrence of cancer, Alzheimer's, Parkinson's disease and osteoporosis.
Bread is often a "gateway" food, leading users to "harder" items such as butter, jam, peanut butter, and even ham.
Newborn babies can choke on bread.
It has been shown that children on the autism spectrum watch more television than neurotypical children.
In every case above, there is a statistical relationship, but no evidence of causation. The true explanations usually involve common factors, cultural patterns, or simple coincidence. For instance, bread is a staple food eaten by the vast majority of people, so its consumption cannot be meaningfully linked to criminal behaviour. The lower test scores in bread-consuming households have nothing to do with bread itself — the correlation is spurious and could be replaced with any common food, such as potatoes. The higher incomes among cat owners likely reflect lifestyle differences (for example, greater flexibility for work travel) rather than any causal effect of owning a cat.
These examples highlight an important principle in research: correlation can reveal interesting patterns between variables, but it does not establish that one variable causes the other. To demonstrate genuine cause and effect, researchers must go beyond correlation and use methods that allow them to control for other variables and test causality directly.
POSITIVE, NEGATIVE AND ZERO CORRELATIONS
POSITIVE CORRELATIONS
Positive correlation is the most common type. As one variable increases, the other variable also increases. For example, there is often a positive correlation between IQ and GCSE scores — pupils with higher IQs tend to achieve higher GCSE grades. A Positive correlation also occurs when one variable decreases while the other decreases. For example, the colder it is, the less comfortable you feel.
Positive correlations occur when two variables move in the same direction. Both variables must move in the same direction, either:
Increasing together ++
Decreasing together - -
ZERO (NO) CORRELATION
Zero correlation occurs when there is no relationship between the two variables. The values of one variable do not predict or relate to the values of the other in any consistent way.
NEGATIVE CORRELATION
In a negative correlation, as one variable increases, the other variable decreases. For example, it might be reasonable to assume that the higher a person’s stress levels, the lower their life expectancy. However, as is always the case with correlations, we cannot show cause and effect. The link between high stress and lower life expectancy could be due to secondary habits such as smoking, poor diet, or lack of exercise rather than stress itself.
Negative correlations occur when two variables move in opposite directions.
As one variable increases +
The other variable decreases -
THE MINUS NUMBER IN NEGATIVE CORRELATIONS
Please note that the minus sign in negative correlations does not denote negative numbers — it simply indicates the direction of the relationship. The exam question below examines this
EXAMINATION QUESTION ON NEGATIVE CORRELATIONS
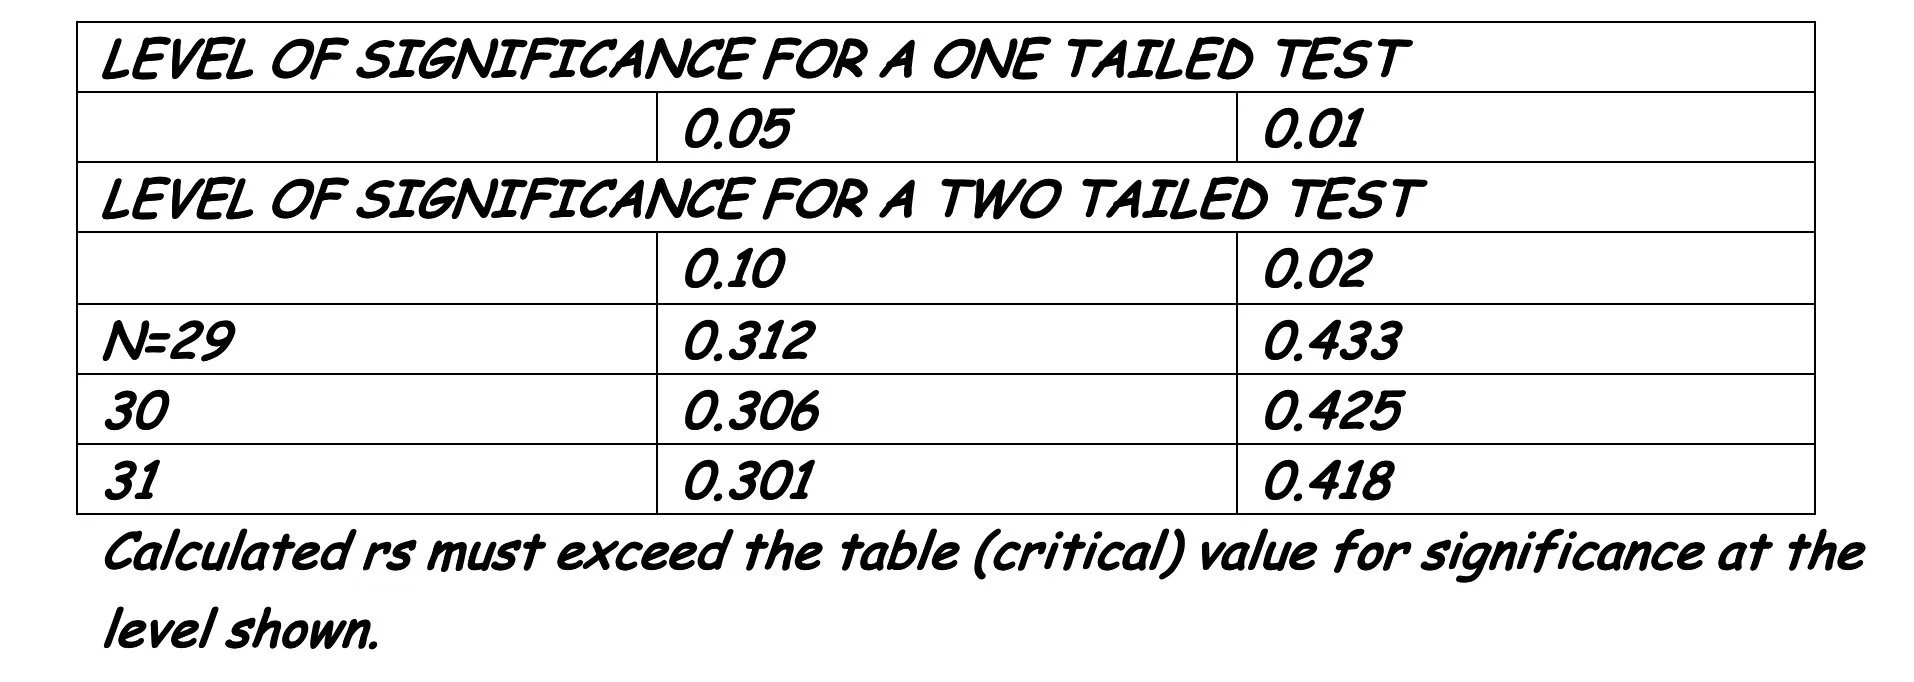
Two psychologists investigated the relationship between age and recall of medical advice. Previous research has shown that recall of medical advice tended to be poorer in older patients. The study was conducted at a doctor’s surgery and involved 30 patients aged 18-78 years. They all saw the same doctor, who took notes on the advice she gave during the consultation. One of the psychologists interviewed each patient individually immediately after they had seen the doctor. The psychologist asked each patient a set of questions about what the doctor had said about their diagnosis and treatment. The patient’s responses were recorded and then typed out. Working independently, the psychologists compared each typed account with the doctor’s written notes to rate the accounts' accuracy on a scale of 1–10. A high rating indicated that the patient’s recall was very accurate. The psychologists used a Spearman’s rho to analyse the data from their investigation. They chose to use the 0.05 level of significance. The result gave a correlation coefficient of -0.52.
QUESTIONS ON NEGATIVE CORRELATIONS
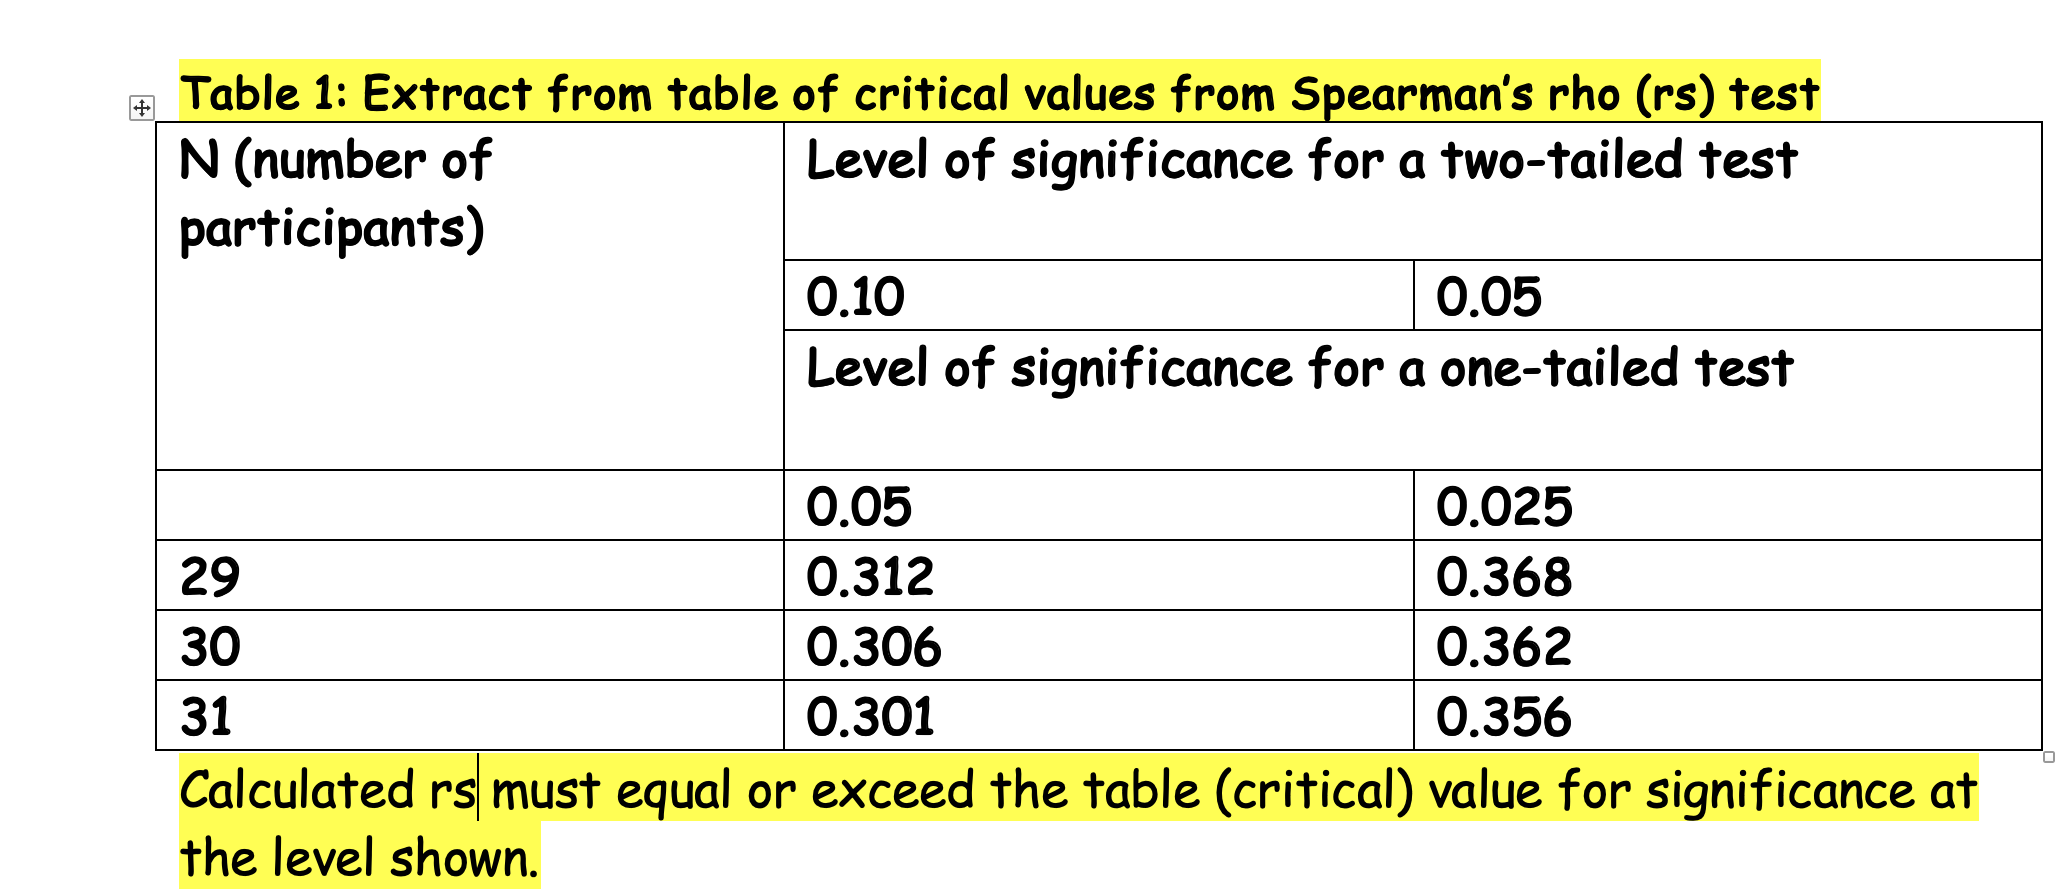
Using Table 1 below, state whether the result is significant or non-significant and explain why. (2 marks)
Explain what is meant by a Type 1 error. (2 marks)
Use the information in Table 1 above to explain why the psychologists did not think that they had made a Type 1 error in this case. (3 marks)
Q1Many students saw the minus sign in -0.52 and treated it as a negative number less than zero. They compared –0.52 directly to the critical value (0.306) and thought “–0.52 is less than 0.306”, so they wrongly concluded the result was non-significant. They did not understand that the minus sign only shows direction and that for significance testing, you must use the absolute value (0.52). The result is significant. The calculated correlation coefficient is rs = -0.52. For N = 30 at the 0.05 level (one-tailed test), the critical value is 0.306. Because the absolute value of the coefficient (0.52) is greater than the critical value (0.52 > 0.306), the result is statistically significant at the 0.05 level.
Q2: A Type 1 error occurs when the null hypothesis is rejected when it is actually true. In other words, the researcher concludes there is a real correlation when in reality there is none. This is a false positive result. The probability of making a Type 1 error is equal to the significance level used (e.g. 5% at the 0.05 level).
Q3: Students who misread –0.52 as a negative number said the result was non-significant, so they could not explain why the psychologists were confident. Even those who got significance correct sometimes failed to mention that the result was significant at the stricter 0.01 level, which is why it was considered highly significant.The psychologists did not think they had made a Type 1 error because the result was highly significant. The calculated value (rs = -0.52) exceeded the critical value at both the 0.05 level (0.306) and the stricter 0.01 level (0.425) for N = 30 (one-tailed test). Because the result is significant at the 0.01 level, the probability of obtaining this result by chance (if the null hypothesis were true) is less than 1%. This low probability means the negative correlation between age and recall accuracy is very unlikely to be a false positive.
DIRECTIONAL (1-TAILED) AND NON-DIRECTIONAL (2-TAILED) HYPOTHESES
DIRECTIONAL (1-TAILED) HYPOTHESES
Both positive and negative correlations are examples of directional (1-tailed) hypotheses. This is because they predict a specific direction to the relationship. A positive correlation predicts that the two variables will move in the same direction. A negative correlation predicts that the two variables will move in opposite directions.
In both cases, the researcher is making a clear, one-sided prediction about how the variables will change together. Because the prediction is only testing one possible direction, it is called a 1-tailed hypothesis.
NON-DIRECTIONAL (2-TAILED) HYPOTHESES
When a researcher is unsure whether the relationship will be positive or negative, they may simply predict that a correlation will exist without specifying the direction. This is called a non-directional (2-tailed) hypothesis. The researcher is not committing to whether the variables will move in the same direction or in opposite directions. They are only predicting that the two variables will be related in some way. Because both directions (positive and negative) are possible, it is described as a 2-tailed hypothesis.
EXAMPLE USING BIRTH ORDER AND INTELLIGENCE
Research has shown that intelligence among siblings is positively correlated. This is likely due to IQ being heritable or because siblings receive similar educational opportunities.
Now consider three psychologists who have different views on the relationship between birth order and intelligence:
The first psychologist believes the relationship is mainly genetic and predicts that later-born siblings will tend to have slightly higher IQs. She writes a directional (1-tailed) hypothesis: “There will be a positive correlation between birth order and IQ.”
The second psychologist believes older siblings are more intelligent than younger ones because they are given more responsibility and strive harder to please their parents after being displaced by younger siblings. He predicts the opposite direction and writes a directional (1-tailed) hypothesis: “There will be a negative correlation between birth order and IQ.”
The third psychologist has reviewed the existing research and finds the evidence mixed — some studies show a positive link, while others show a negative one. Because he is genuinely unsure about the direction, he chooses a non-directional (2-tailed) hypothesis: “There will be a correlation between birth order and IQ.
All three psychologists predict a relationship between birth order and intelligence, but only the first two predict its direction. The third psychologist is leaving the direction open because the evidence so far does not clearly favour one outcome over the other.
EXAMPLES
Directional (1-tailed) hypothesis: There will be a positive correlation between IQ and birth order.
Directional (1-tailed) hypothesis: There will be a negative correlation between IQ and birth order.
Non-directional (2-tailed) hypothesis: There will be a correlation between IQ and birth order.
Null hypothesis: There will be no correlation between IQ and birth order
CORRELATION COEFFICIENTS
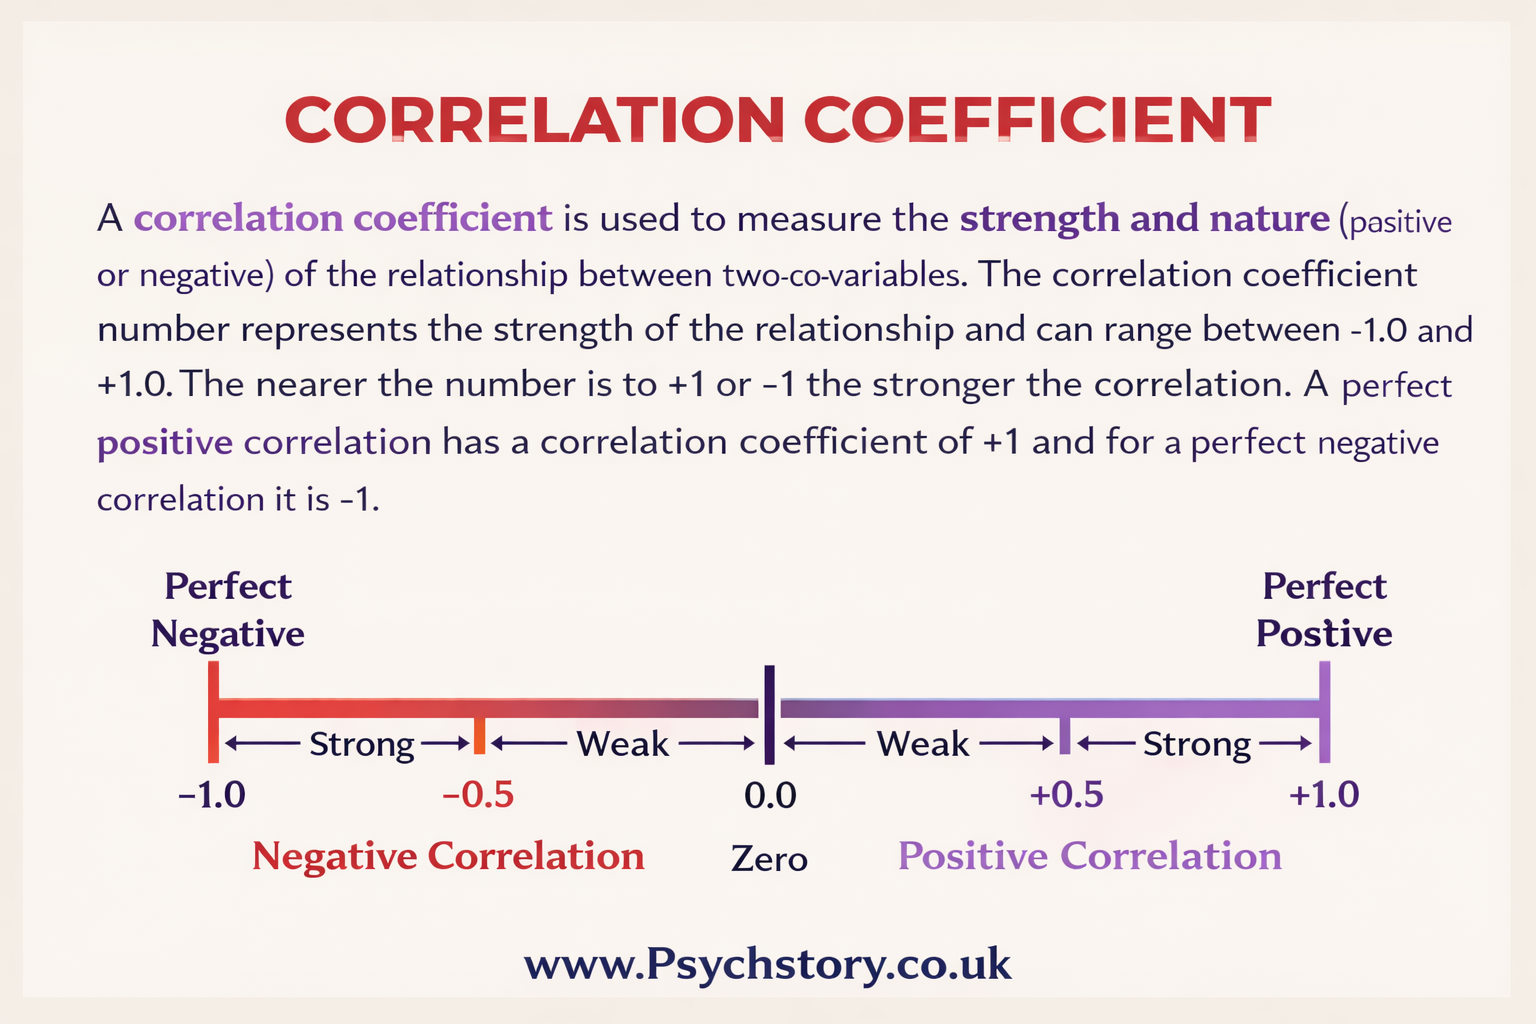
Once a relationship between two variables has been identified, researchers need an objective way to measure its strength and direction. This is achieved through the correlation coefficient. The correlation coefficient is an inferential statistic that provides a precise numerical value (denoted as r) indicating three important things: the strength of the relationship, the direction of the relationship, and whether the relationship is statistically significant. Unlike subjective descriptions such as “quite strong” or “weak”, the coefficient gives an exact, measurable figure between -1 and +1.
The value of the coefficient tells us how closely the pairs of scores lie along a straight line:
+1.0 represents a perfect positive correlation (as one variable increases, the other increases perfectly in step).
-1.0 represents a perfect negative correlation (as one variable increases, the other decreases perfectly in step).
0 represents no correlation (zero relationship) between the two variables.
The further the coefficient moves away from zero (towards either +1 or -1), the stronger the relationship. As a general guide:
Coefficients between 0.5 and 0.9 (or -0.5 and -0.9) are usually considered moderate to strong.
Coefficients below 0.5 (or -0.5) are generally regarded as weak. Below, are a few more examples
0.0 < 0.1 no correlation
0.1 < 0.3 little correlation
0.3 < 0.5 medium correlation
0.5 < 0.7 high correlation
0.7 < 1very high correlation
GRAPHS AND CORRELATION COEFFICIENTS
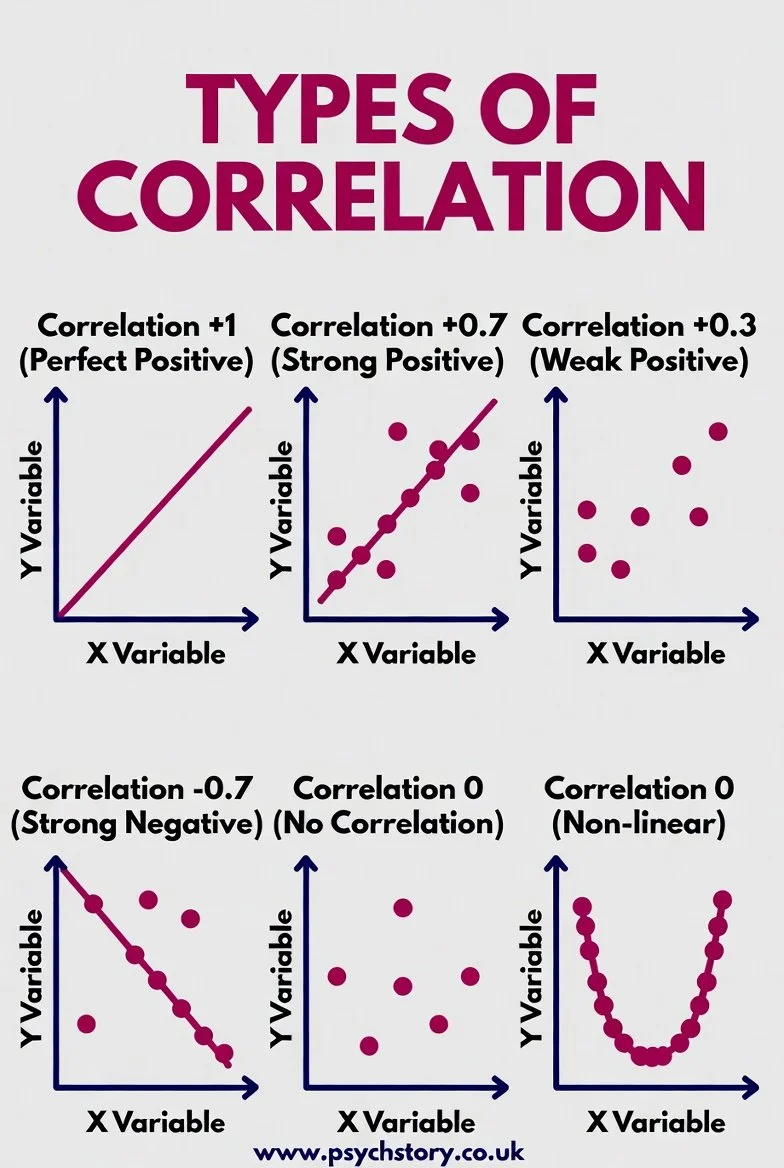
Correlations are best illustrated using scattergrams (also called scattergraphs). A scattergram is a graphical representation that shows the relationship between two variables at a glance by plotting all paired scores.
When drawing a scattergram, it does not matter which variable you put on the x-axis and which you put on the y-axis. What matters is that each pair of scores is plotted correctly together. For every participant (or every case), you have two values — one for each variable. You decide which variable goes on the horizontal (x) axis and which goes on the vertical (y) axis, then place a cross (or dot) at the point where those two values meet.
For example, if you are looking at the relationship between hours spent revising and exam grade, you might put “hours spent revising” on the x-axis and “exam grade” on the y-axis. For each student, you find the point where their revision hours and their exam grade intersect and mark it with a cross. When you have plotted all the pairs, the pattern of crosses will show you whether there is a relationship, how strong it is, and in which direction it goes.
The advantage of a scattergram is that it gives a visual picture of the data before you calculate the correlation coefficient. You can see at a glance whether the points form a clear line (strong correlation), a loose cloud (weak correlation), or no pattern at all (zero correlation). This visual check is very useful because it helps you understand what the numerical correlation coefficient actually means in real terms
INFERENTIAL STATISTICS: CORRELATION
The level of measurement determines which correlation coefficient is appropriate.
Spearman’s rho is used when the data are ordinal or when the assumptions of more advanced tests are not met. It works by converting scores into ranks and assessing the relationship between those ranks.
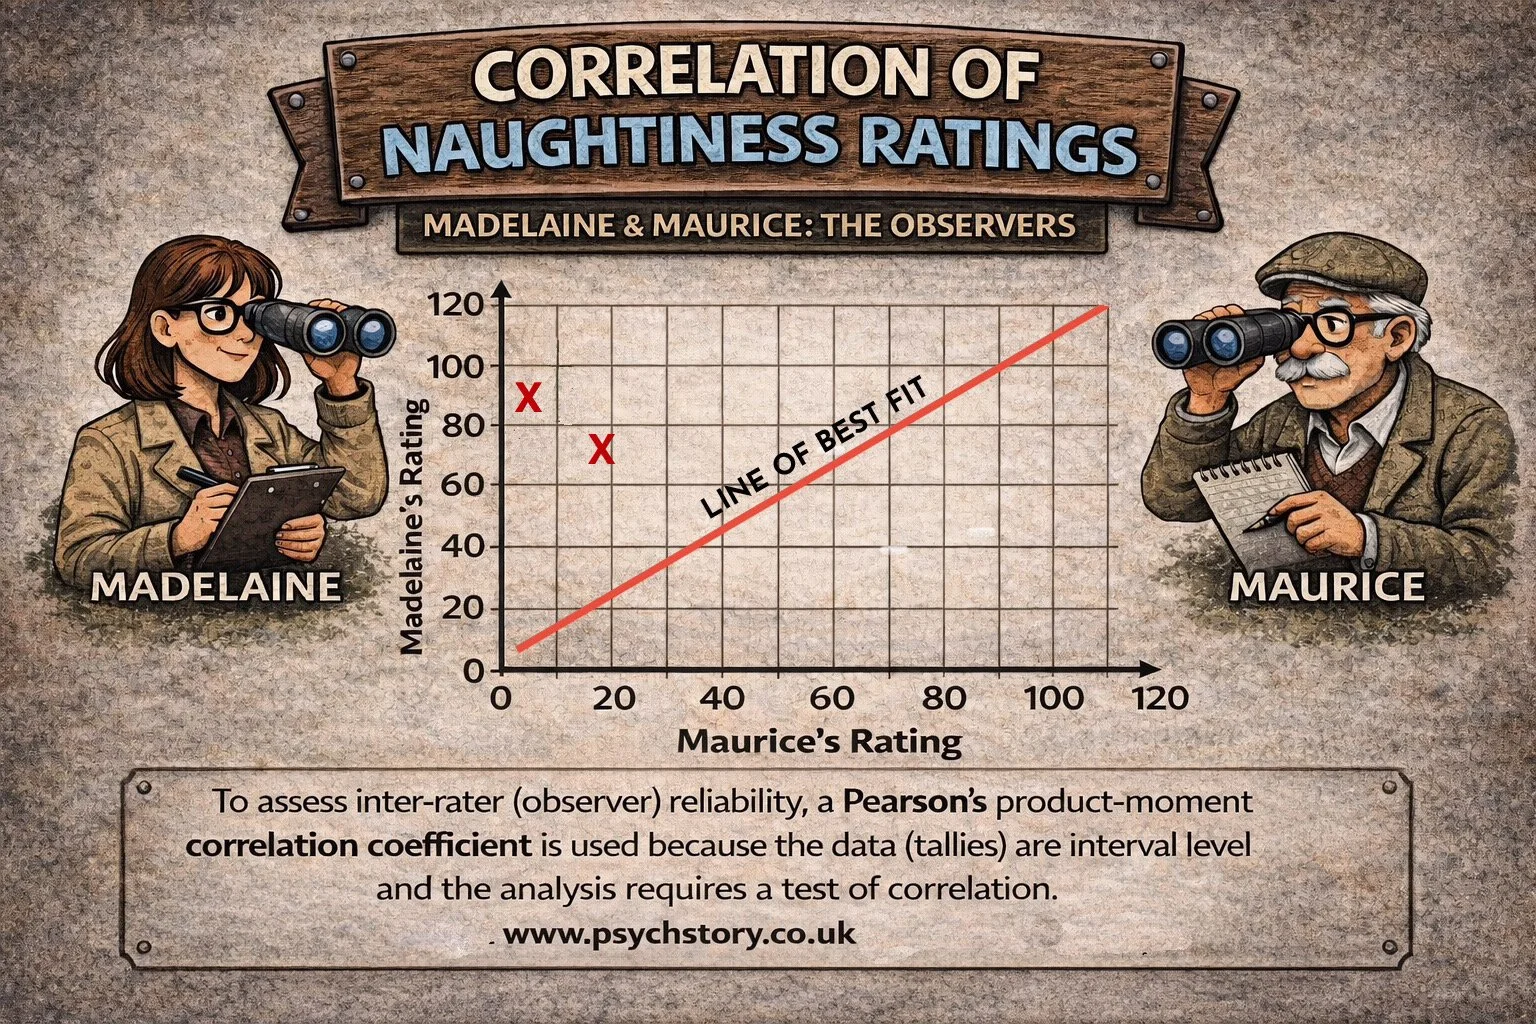
Pearson’s r is used when data are interval or ratio and meet the assumptions of parametric testing, including linearity and normality. It measures the strength of a linear relationship between two continuous variables
STRENGTHS AND USES OF CORRELATIONS
Correlation is a valuable statistical tool in psychology for several important reasons.
First, correlation enables researchers to investigate naturally occurring variables that would be unethical or impractical to manipulate experimentally. For example, it would be clearly unethical to deliberately expose people to large amounts of cigarette smoke in order to test whether smoking causes lung cancer. Correlation allows researchers to examine the relationship between smoking and lung cancer by studying people who already smoke different amounts, without needing to assign them to conditions.
Second, correlation allows researchers to assess whether two variables are related. Once a relationship has been identified, it can be displayed graphically using a scattergram, which helps visualise the data's pattern.
Third, correlation is particularly useful for preliminary research. Before investing the time, money, and resources required for a full experimental study, researchers can use correlation to test the waters and determine whether a meaningful relationship appears to exist between the variables. If no relationship is found, it may save them from pursuing a more expensive experiment.
Correlation also allows researchers to infer how one variable might influence another when true experimentation is either unethical or impossible. This makes it an essential method when studying complex human behaviours that cannot be easily isolated in a laboratory. Additionally, correlation is widely used to measure concordance rates between family members. For example, researchers can examine the extent to which one family member having a mental illness is associated with another family member also having the same illness. This helps estimate the genetic or environmental contribution to certain disorders.
Finally, correlation is a useful tool for testing the reliability of measurements. It can be used in two main ways:
Test-retest reliability: to check whether the same measure produces consistent results when given to the same people on different occasions.
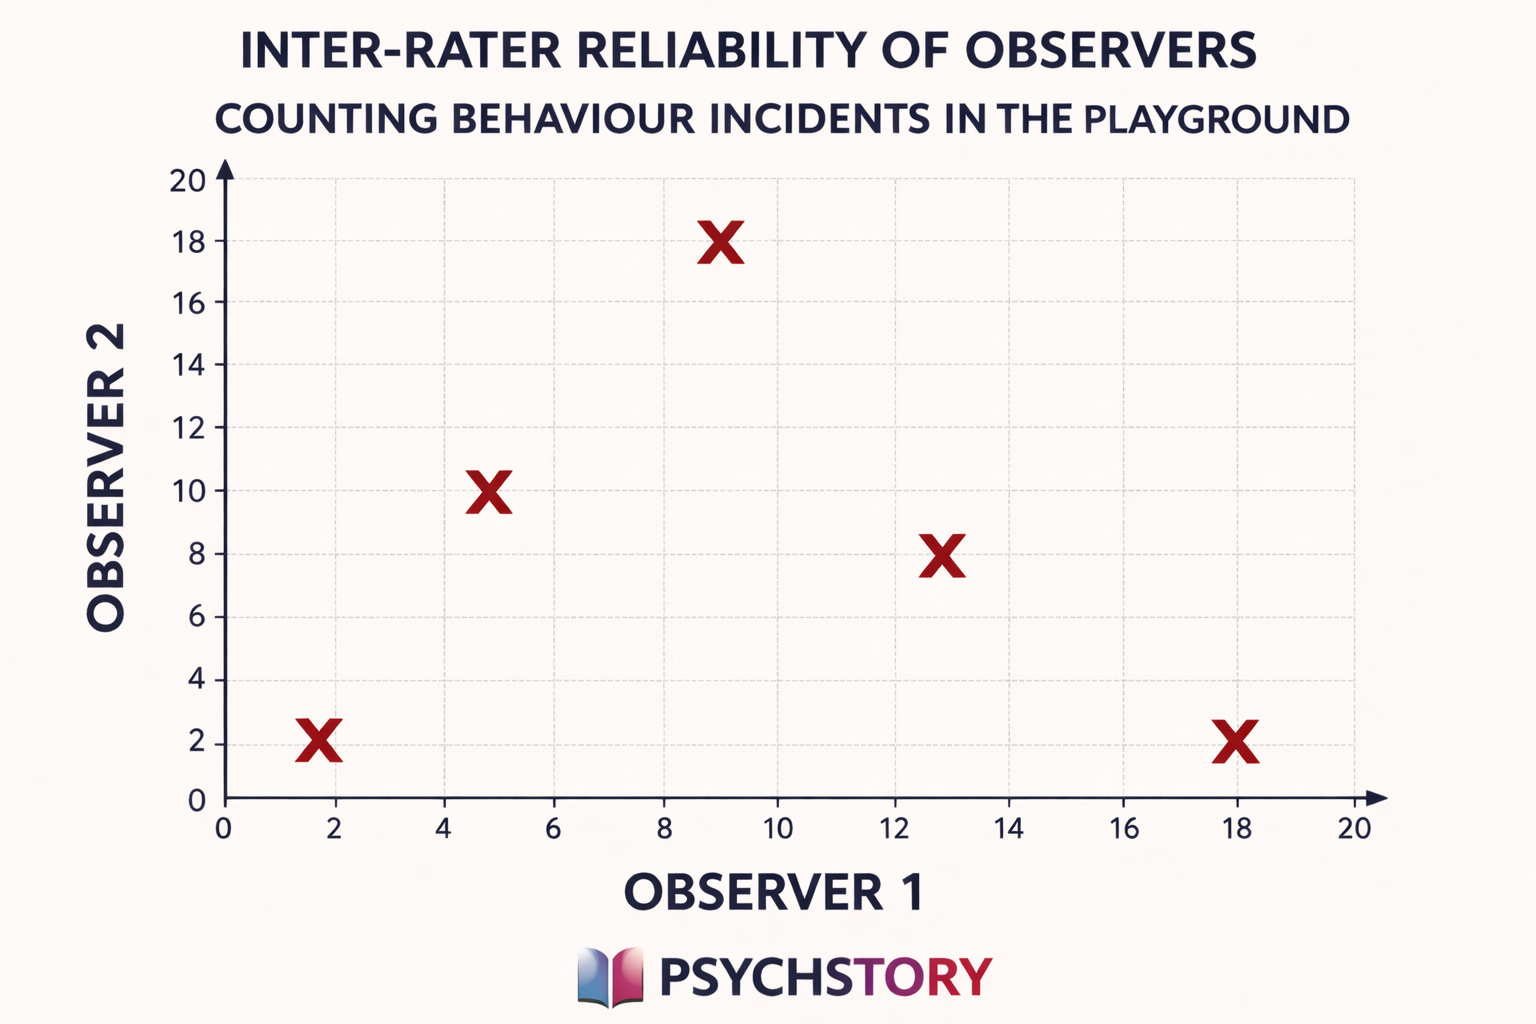
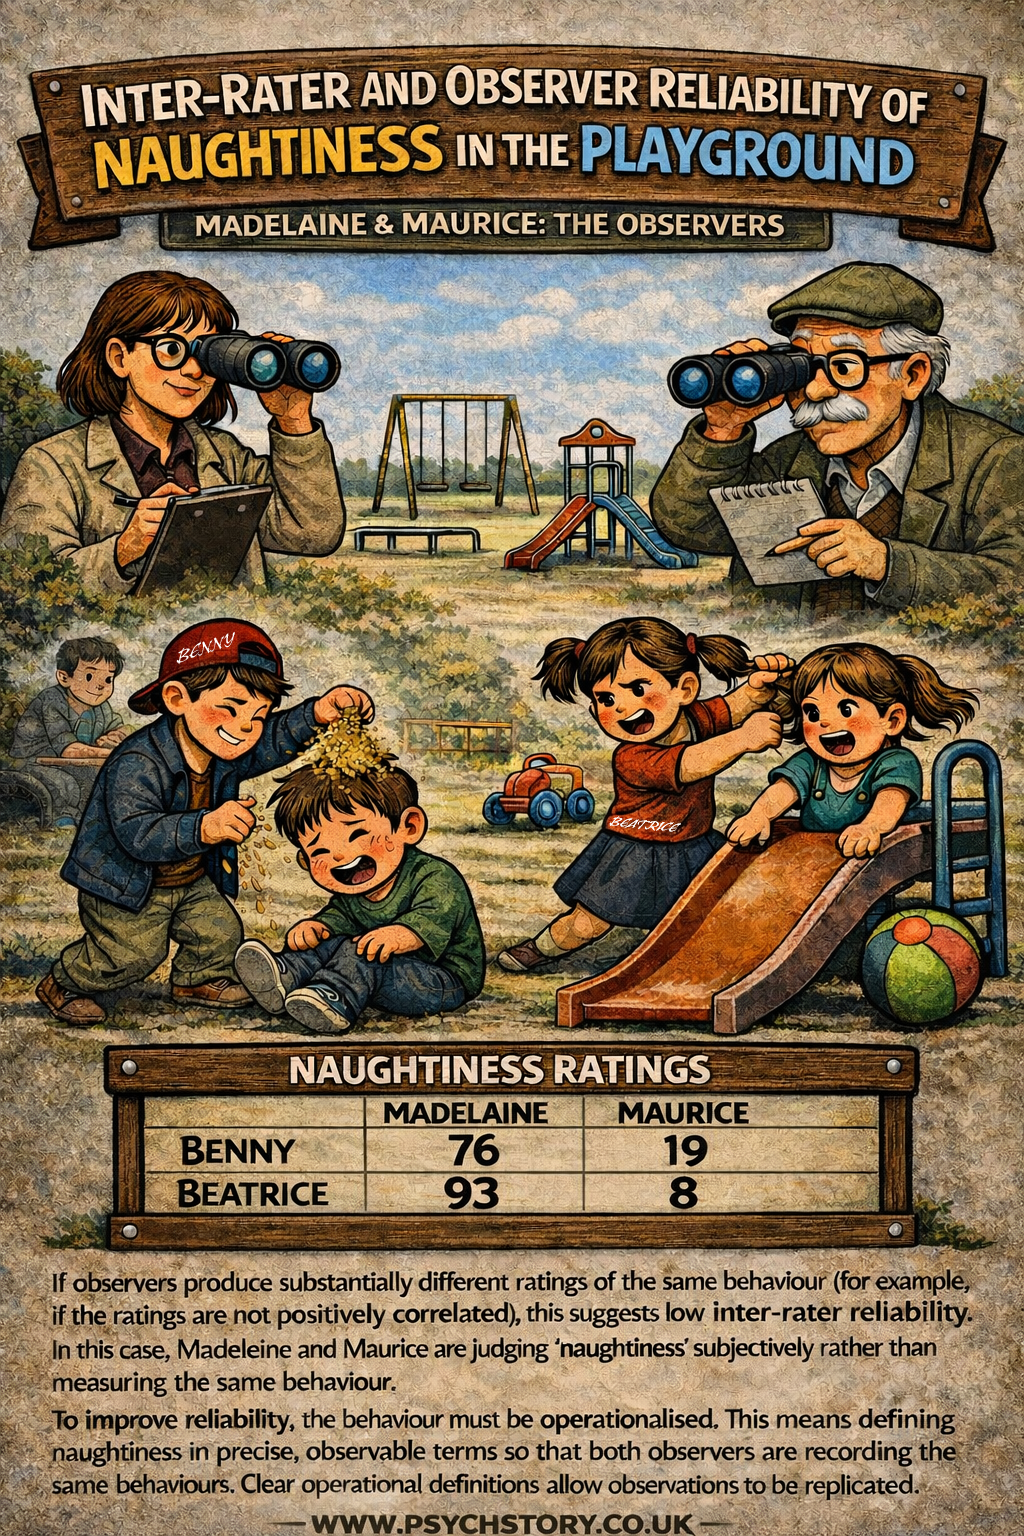
Inter-rater reliability: to check whether different observers or raters produce consistent results when measuring the same thing.
DISADVANTAGES OF CORRELATIONS
While correlation is a useful and widely used statistical technique, it has several important limitations.
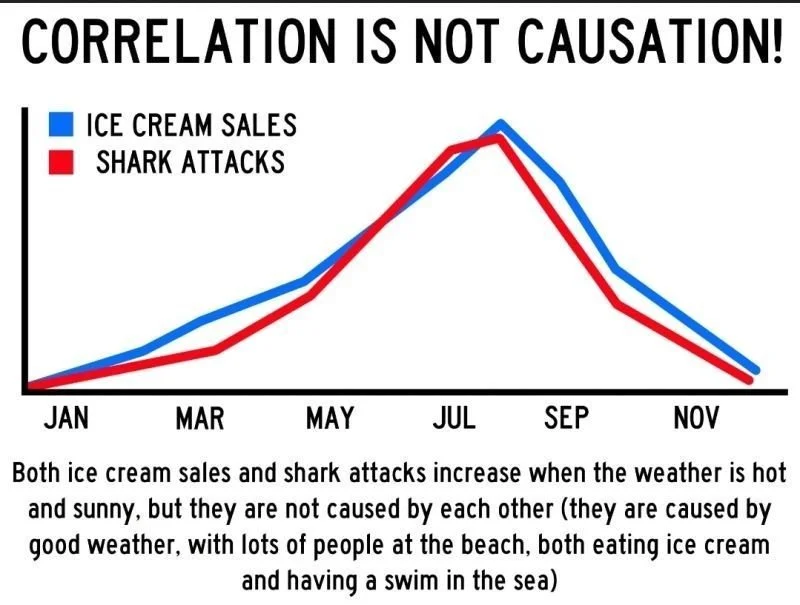
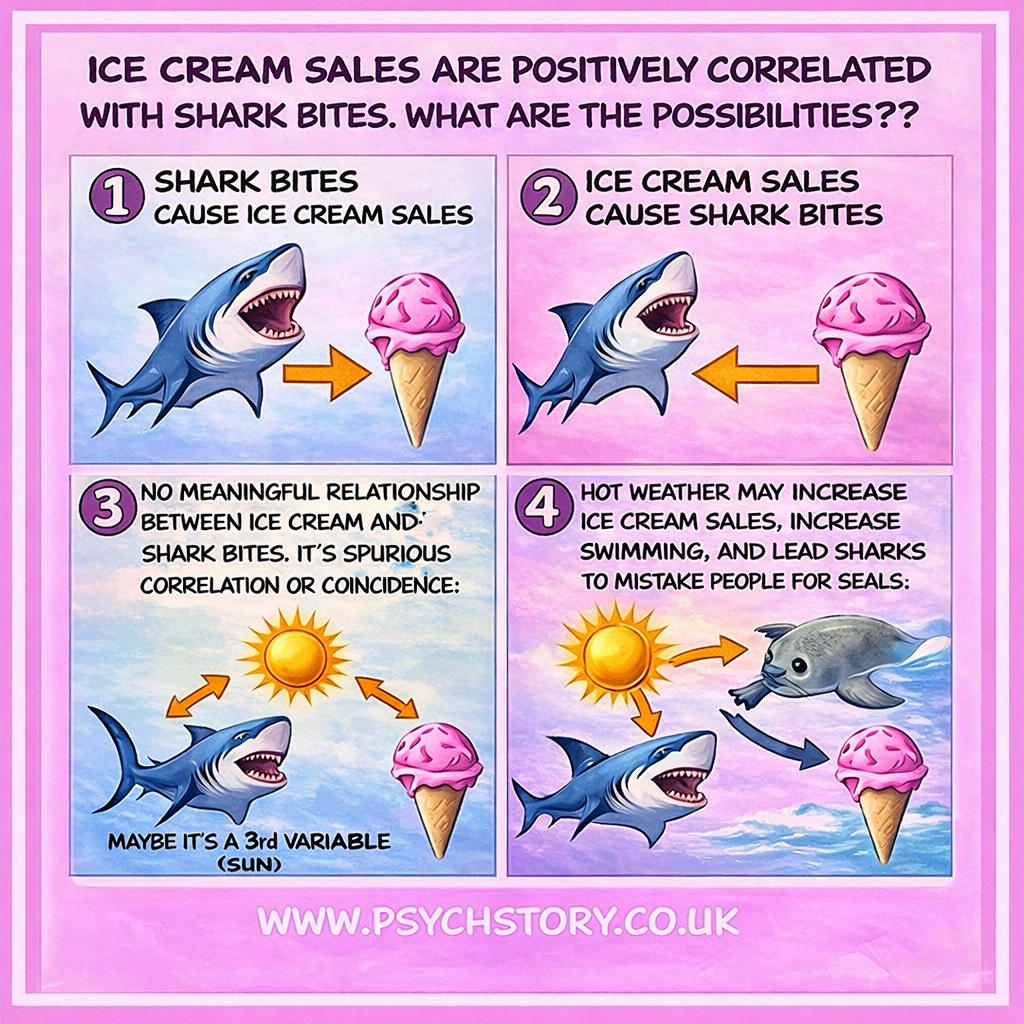
The most serious disadvantage is that correlation does not show cause and effect. Even a very strong correlation between two variables does not prove that one causes the other. The relationship could be in the opposite direction, or it could be caused by a third, unmeasured variable (often called a confounding variable). For example, a positive correlation between ice cream sales and drowning incidents does not mean ice cream causes drowning — both are related to hot weather. This inability to establish causation is the main reason why correlation is rarely the first-choice method when researchers want to test a causal hypothesis.
Another limitation is that correlation can produce spurious (false) relationships. Because so many variables in the real world are related in complex ways, it is easy to find statistically significant correlations that are actually meaningless or coincidental. Without careful interpretation and further research, these spurious correlations can lead to incorrect conclusions. Correlation does not allow us to go beyond the data provided. For example, suppose an association was found between time spent on homework (1/2 hour to 3 hours) and the number of GCSE passes (1 to 6). It would not be legitimate to infer from this that spending 6 hours on homework would likely generate 12 GCSE passes. Correlation is also limited when researchers need to study rare events or extreme behaviours. In such cases, it can be difficult to obtain enough data to calculate a reliable correlation coefficient, or the relationship may only hold under very specific conditions that are hard to capture in correlational studies.
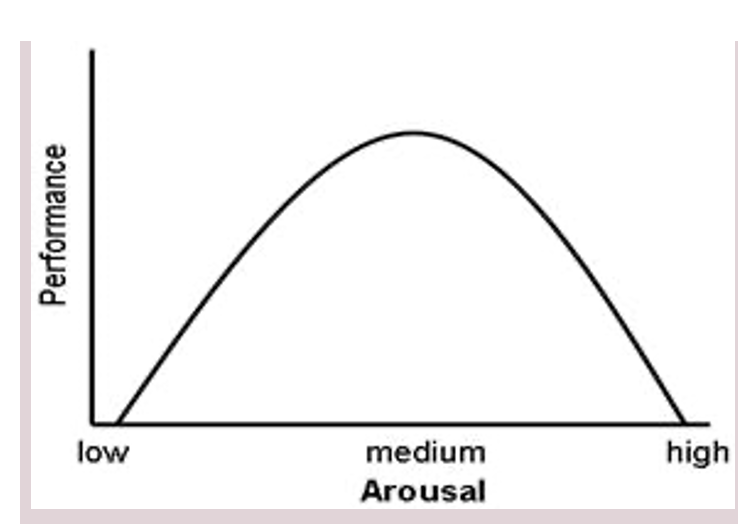
Curvilinear correlations: Finally, correlation assumes linearity — that the relationship between the two variables is roughly straight-line. If the relationship is curved or more complex (for example, moderate anxiety improves performance, but very high anxiety impairs it), a simple correlation coefficient may miss or misrepresent the true pattern. Because of these limitations, correlation is best seen as a starting point rather than a final conclusion. It is excellent for identifying possible relationships and generating hypotheses, but it usually needs to be followed up with experimental or other research methods to establish causation
QUASI EXPERIMENTS
Consider these two hypotheses: 1. “Female participants aged 15–24 will exercise more than female participants aged 25–34.” 2. “Older men will exercise less than younger men.” Although both hypotheses involve age and exercise, they require different research methods because they treat age in fundamentally different ways. In the first hypothesis, age is treated as a categorical variable divided into discrete groups (15–24 and 25–34). The researcher is comparing the average amount of exercise between these two pre-existing groups rather than examining a continuous relationship. In this sense, the categories are treated as the independent variable (IV). This design is better suited to a quasi-experimental approach. In quasi-experiments, the independent variable (here, age group) is not manipulated by the researcher — the groups already exist naturally. The researcher simply compares the dependent variable (exercise levels) across the two different groups.
In the second hypothesis, age is treated as a continuous variable (ranging across all ages rather than fixed categories). The researcher is interested in the overall relationship between increasing age and decreasing exercise. This is more appropriate for correlation analysis, where both variables are measured continuously, and the strength of their association is calculated. The key distinction lies in how age is handled in the analysis. When age is split into discrete categories (e.g., 15–24 vs 25–34), a quasi-experimental design is usually more suitable. When age is kept as a continuous variable (measured across its full range), correlation is the better choice. Quasi-experimental designs typically involve at least three variables: independent variables (e.g., age groups), a dependent variable (e.g., exercise behaviour).
In contrast, Correlations require two co-variables measured at least at the ordinal level, typically at the interval or ratio level. They examine how one variable changes in relation to another. They do not compare categories such as male versus female or young versus old. The moment a variable is turned into categories, the design shifts away from correlation and towards a group comparison.
“NORMAL” CORRELATIONS
Correlations usually compare behaviour patterns or responses from one set of individuals. This type of correlation involves collecting data from the same person on two different measures. For example: “There will be a positive correlation between a smoker’s age and the number of cigarettes they smoke per day — the older the person, the more cigarettes they will smoke.” In this case, both pieces of data (age and cigarette consumption) come from the same individual. Standard correlations measure the relationship between two variables within the same individuals or matched pairs. However, not all correlations are of this type.
Intraclass correlation refers to comparisons within clustered or related groups. The key distinction lies in the relationship between participants. On the other hand, in ICC studies, participants are related or clustered, such as family members, students in the same classroom, or patients in the same healthcare facility. The focus is on examining the agreement or similarity of measurements within these related groups.
INTRACLASS CORRELATIONS
You cannot correlate two unrelated groups of people. If a comparison was made between the IQs of two psychology classes, why would one student be randomly correlated with any particular student in the other class? The results would be meaningless/ In quasi-experimental designs, participants are unrelated individuals assigned to different groups or conditions based on pre-existing characteristics or criteria. For example, comparing IQ scores across different psychology classes would constitute a quasi-experimental design because the point is comparing unrelated groups. But when correlations compare two sets of people, they must be based on related individuals, such as family members, spouses, or friends. You cannot correlate random unrelated people because there is no meaningful pairing of data.
An intraclass correlation coefficient (ICC) is a statistical measure used to assess the degree of agreement among observations made on the same subjects, groups, or family members. It measures the consistency or reliability of measurements made within clustered or related groups of people. For example, consider a study comparing IQ scores between older and younger siblings within the same families. In this scenario, each family represents a cluster, and the IQ scores of siblings within each family are compared. The intraclass correlation would assess the extent to which IQ scores within the same family are similar. The confusion arises because both involve groups, but they are fundamentally different: quasi-experiments compare unrelated groups, whereas intraclass correlations examine similarity within related or clustered groups. Another example of intraclass correlation is when two observers are rating the same behaviour (inter-rater reliability) or when measuring consistency within the same set of individuals. All raters are judging the same behaviour, the same person, or the same set of responses. This means the data are clustered around one shared source. Each rater produces a score, and those scores are then compared to see how closely they match. The question is not “does X person relate to Y person ?” but “do these raters agree with each other when judging the same thing? This is why it is called intraclass: the comparison takes place within a single class, group, or target, rather than between separate variables or unrelated groups.
CONCORDANCE RATES
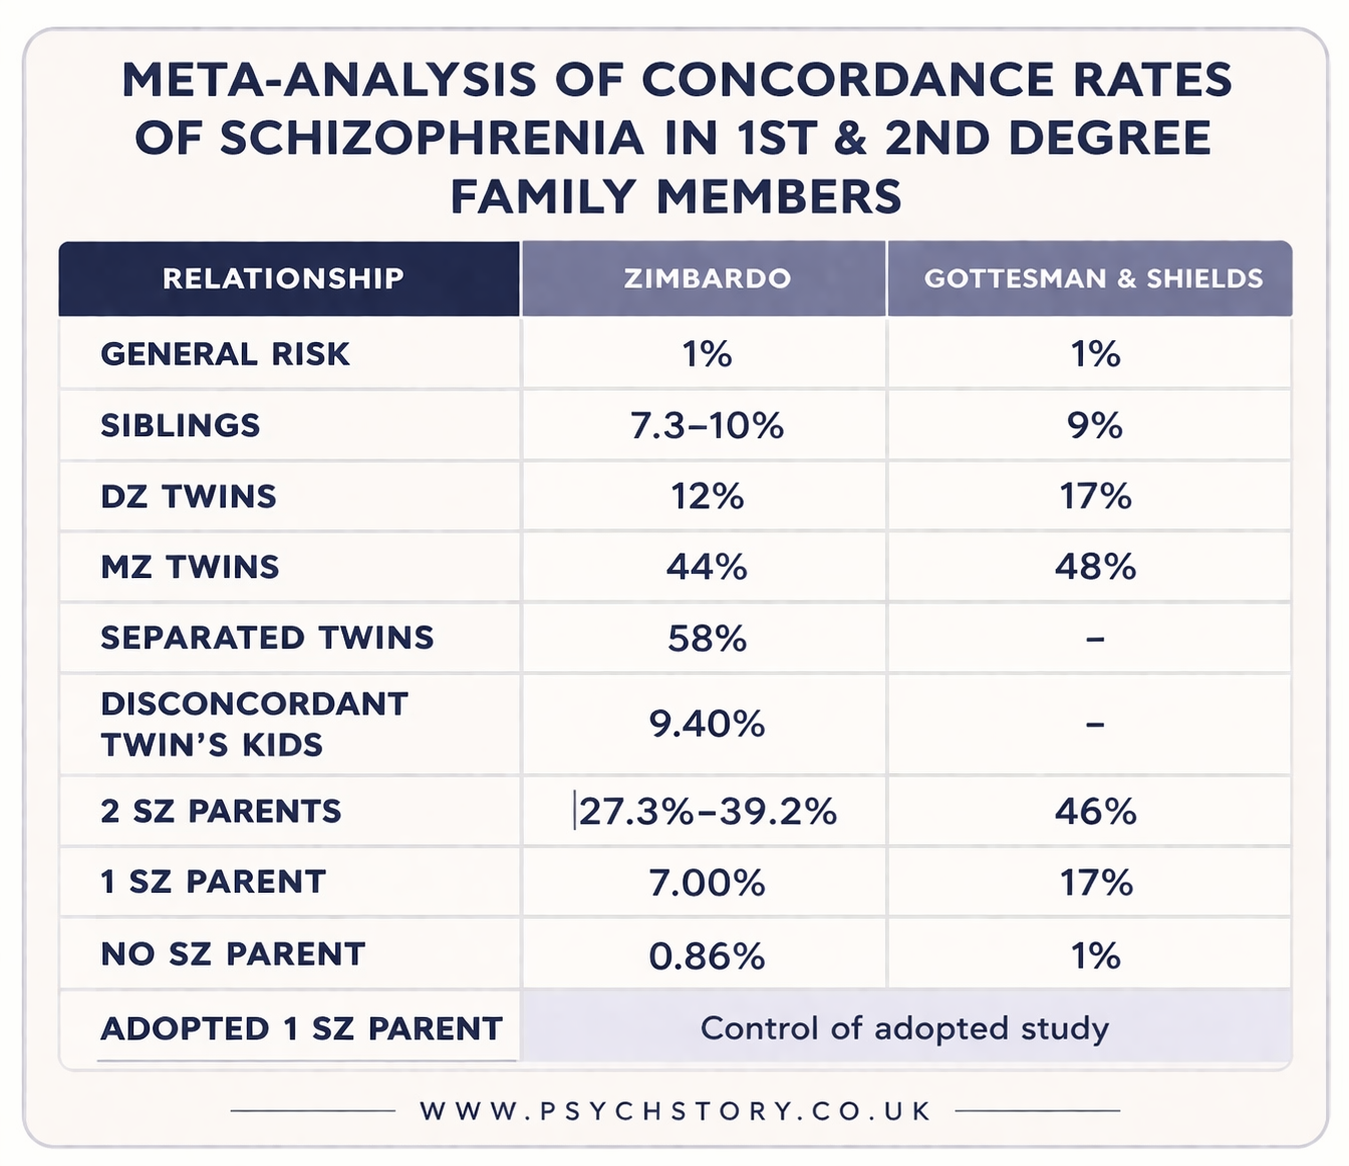
Concordance rates of schizophrenia within families are an excellent example of ICCs in practice. In this context, researchers might investigate the prevalence of schizophrenia or other mental illnesses among family members, such as parents, siblings, and children of individuals diagnosed with schizophrenia. The ICC would measure the extent to which the occurrence of schizophrenia is consistent or correlated within these family units. In summary, while both ICC studies and quasi-experimental designs involve comparing groups of individuals, the distinction lies in whether the participants are related or clustered. ICC studies assess agreement within related groups, whereas quasi-experimental designs compare unrelated individuals across different groups or conditions
ACTIVITY
TEST OF DIFFERENCE OR CORRELATION –
INSTRUCTION
For each scenario, decide:
Are the scores paired (linked individuals) → correlation
Or are they separate groups being compared → test of difference (quasi)
For each, briefly justify your decision by stating whether the data are paired or whether participants are in separate groups.
Males, females, and their IQs
Spouses and their IQs
Siblings and their IQs
Best friends and weight
Redheads, blonde-haired people, and digit span
Mothers, daughters, and alcohol consumption
Male and female and alcohol consumption
Twins and the amount smoked
Cousins and number of children
Labradors, Rottweilers, and the aggressiveness scale
Siblings and whether attractive, average or unattractive
People who eat cheese or do not, and the number of nightmares recorded
QUESTIONS ON CORRELATIONS
For each statement:
Q1: Write ++ or - - positive), - + (negative).
Q2: Write “directional” or “non-directional”
As a biker’s speed increases, their time to get to the finish line decreases.
As the temperature rises, ice cream sales rise.
As one exercises more, their body weight decreases.
The more one smokes cigarettes, the more one's ability to breathe deeply decreases.
As snowfall totals increase, the number of people driving decreases.
The longer someone runs, the less energy they have.
As the number of trees cut down increases, the probability of erosion increases.
The more time you spend running on a treadmill, the more calories you burn.
As humidity increases, people's desire to be outside may decrease.
The more one works, the less free time one has.
As a student’s study time increases, so do their test averages.
When the supply of a particular product decreases, the demand for it increases.
As the slope of a hill increases, the speed at which a walker reaches the top may decrease.
The longer you spend in the bath, the more wrinkly your skin becomes.
As the temperature decreases, people purchase more heaters.
The more customers spend, the higher a country's GDP.
As a tadpole gets older, its tail gets smaller.
When lions sleep more, they have less time to hunt during the day.
As the speed of a wind turbine increases, the amount of electricity generated increases.
The more one eats, the less hunger one will have.
As algae increase in a lake, a particular species of algae-eating fish increases.
The less time you spend marketing your business, the fewer new customers you will have.
As the temperature increases, customers buy fewer hot chocolate products.
The more you exercise your muscles, the stronger they get.
As a rosebush with many thorns will attract fewer animals that want to eat it.
When college enrolment decreases, the number of teachers decreases.
As the moisture content of an environment increases, the growth of mould spores increases.
The longer someone invests, the more compound interest they will earn.
If it is darker outside, more light is needed inside.
The more time you study or prepare for a test, the fewer mistakes you'll make.
As the salt concentration in saline water increases, buoyancy increases.
As one ages, one's agility often decreases.
The more gasoline you put in your car, the farther it can go.
When an employee works more hours, their paycheck also increases.
As the wattage of light bulbs increases, the light output increases.
The older an animal gets, the fewer offspring it can have.
If a car slows down, its travel time to a destination increases.
As you drink more coffee, the number of hours you stay awake increases.
Schools with high test scores also have high graduation rates.
As tread on your car’s tyres decreases, traction with the road decreases.
The more money you save, the more financially secure you feel.
When workers get a raise, morale improves.
As a child grows, so does their clothing size.
The faster a jet pilot flies, the higher the G-forces are.
As the weather gets colder, air conditioning costs decrease.
Students with strong attendance records also have higher grades.
As you eat more antioxidants, your immune system improves.
If a car tyre has more air in it, the car may use less gas per mile.
The longer your hair grows, the more shampoo you will need.
When employment is high, inflation tends to rise due to increased economic activity.
As a tree matures, it requires water less frequently.
Hiring more salespeople will increase the company's sales.
As snowfall increases, sales of snow shovels rise.
The more one exercises, the fewer health problems they are likely to have.
In areas with low rainfall, more wildlife migrate to other areas.
Becoming more involved with school activities increases students' self-esteem.
If a train increases its speed, the time to reach the final point decreases.
As the temperature decreases, the speed of molecular motion decreases.
Investing in professional development for teachers also increases overall student achievement.
A student with frequent absences experiences declining grades.
The larger a herd of animals gets, the less food there is.
When an animal's hunger increases, its self-protection decreases.
The more years of education you complete, the higher your earning potential will be.
As you spend more time brushing your teeth, you'll have fewer cavities.
As the speed of a biker increases, their time to get to the finish line decreases.
The more customers spend, the higher a country's GDP.
As tread on your car’s tyres decreases, traction with the road decreases.
When college enrolment decreases, the number of teachers decreases.
The more you pay off a loan, the less debt you'll have.
As the number of trees cut down increases, the probability of erosion increases

EXAMINATION QUESTIONS ON CORRELATIONS
A psychological study recorded the number of hours that children spent in a daycare setting from birth to age 3 and asked each child’s primary caregiver to rate their child's aggression. The study found that as the number of hours spent in day care increased, parents’ aggression ratings also increased. What type of correlation is this research indicating? (1 mark)
Discuss why it might be more appropriate for a researcher to use a correlation study rather than an experiment. (3 marks)
Outline one strength and one weakness of using correlational methods in psychological research. (4 marks)
Two psychologists investigated the relationship between age and recall of medical advice. Previous research has shown that recall of medical advice tended to be poorer in older patients. The study was conducted at a doctor’s surgery and involved 30 patients aged 18-78 years. They all saw the same doctor, who took notes on the advice she gave during the consultation. One of the psychologists interviewed each patient individually immediately after they had seen the doctor. The psychologist asked each patient a set of questions about what the doctor had said about their diagnosis and treatment. The patient’s responses were recorded and then typed out. Working independently, the psychologists compared each typed account with the doctor’s written notes to rate the accounts' accuracy on a scale of 1–10. A high rating indicated that the patient’s recall was very accurate. The psychologists used a Spearman’s rho to analyse the data from their investigation. They chose to use the 0.05 level of significance. The result gave a correlation coefficient of -0.52.
The psychologists decided to propose a directional hypothesis. Why was a directional hypothesis appropriate in this case? (1 mark)
Write a suitable directional hypothesis for this investigation. (3 marks)
The psychologists were careful to consider reliability in this study. What is meant by reliability? (1 mark)
Explain how psychologists might have assessed the reliability of their ratings. (3 marks)
The study collected both qualitative and quantitative data. Based on the study description, identify the qualitative and quantitative data. (2 marks)
The psychologists used a Spearman’s rho to analyse the data from their investigation. They chose to use the 0.05 level of significance. The result gave a correlation coefficient of -0.52
The psychologists used Spearman’s rho to analyse the data from their investigation. Give two reasons why Spearman’s rho was appropriate. (2 marks)
Using Table 1, state whether the result is significant or not significant and explain your answer. (2 marks)

11 Explain what is meant by a type 1 error (2 marks).
12.Use the information in TABLE 1 above to explain why the psychologists did not think that they had made a type one error in this case. (3marks).
A maths teacher wondered whether there was a relationship between mathematical ability and musical ability. She decided to test this out on the GCSE students in the school. From a group of 210 students, she randomly selected 10 and gave each of them two tests. She used part of a GCSE exam paper to test their mathematical ability. The higher the mark, the better the mathematical ability. She could not find a musical ability test, so she devised her own. She asked each student to sing a song of their choice. She then rated their performance on a scale of 1–10, where 1 is completely out of tune and 10 is in perfect tune.
13.Suggest a suitable non-directional hypothesis for this study. (3 marks) AO2/AO3 = 3 marks
14. In your answer book, sketch a scattergraph to represent the data in Table 1. Give the graph an appropriate title and label both axes clearly. (3 marks)
15.Discuss what the data in Table 1 and the scattergraph you have drawn suggest about the relationship between mathematical ability and musical ability. (3 marks)
Some studies have suggested a relationship between intelligence and happiness. To investigate this claim, a psychologist used a standardised test to measure intelligence in a sample of 30 children aged 11 years, drawn from a local secondary school. He also asked the children to complete a self-report questionnaire designed to measure happiness. The intelligence test score was correlated with the happiness questionnaire score. The psychologist used a Spearman’s rho test to analyse the data. He found that the correlation between intelligence and happiness at age 11 was +0.42.
16.Write an operationalised non-directional hypothesis for this study. (2 marks) AO2/AO3 = 2 marks
17.A Spearman’s rho test was used to analyse the data. Give two reasons why this test was used. (2 marks)
18.The psychologist used a non-directional hypothesis. Using Table 1, state whether or not the correlation between intelligence and happiness at age 11 (+0.42) was significant. Explain your answer. (3 marks)
Five years later, the same participants completed the intelligence test and the happiness questionnaire again. This time the correlation was −0.29.
19.With reference to both correlation scores, outline what these findings suggest about the relationship between intelligence and happiness over time. (4 marks)