
REPORTING PSYCHOLOGICAL INVESTIGATIONS

SPECIFICATION: Reporting psychological investigations. Sections of a scientific report: abstract, introduction, method, results, discussion and referencing. Note of reference: Reporting psychological investigations. Note that research is usually called either a thesis, a paper, or psychological research. The terms psychological report and psychological investigation are used exclusively by exam boards
THE CONVENTIONS OF A PSYCHOLOGICAL INVESTIGATION
When psychologists conduct a study, the entire process — from the initial question that motivated the research through to the conclusions drawn from the data — must be documented in a research report. This is not simply a write-up of what was found. It is a full account of every stage of the research: why the study was conducted, what it predicted, how it was designed and carried out, what the data showed, and what conclusions can reasonably be drawn from it. This structure is fixed and universal. Every psychological research report contains the same core sections in the same order, recognised across the entire discipline regardless of the topic being studied. That consistency exists for practical and scientific reasons. A fixed structure means researchers always know where to locate specific information, saving time and establishing a logical protocol that mirrors the order in which research actually unfolds.
The report must account for every stage of the research process without exception, because replication and scrutiny depend entirely on the completeness of that record. A reader who wants to challenge the findings, identify weaknesses in the design, or repeat the study in a different context needs access to the full picture — not a summary, not a selection, but everything. What prompted the research, what it predicted, the precise conditions under which it was conducted, what the data showed, how that data was interpreted, and the raw materials on which all of it rests. Any gap in that record is a gap in the science.
This completeness is what makes the format so important for transparency. When every stage is documented in full, other researchers can scrutinise the work rigorously — identifying flawed methodology, challenging conclusions, or exposing data that has been selectively reported or manipulated. Without a complete record, poor research or outright dishonesty could go undetected. The format does not just organise the research — it holds it accountable.
Understanding what each section contains, and why it appears where it does, is therefore essential — both for reading research critically and for conducting and reporting it properly
This research must follow a very specific formula:
SECTIONS OF A SCIENTIFIC REPORT AND HOW YOU COULD BE QUESTIONED IN AN EXAM
Title: You could be asked to write one and describe the conventions
Abstract: You could be asked to describe the conventions
Introduction: You could be asked to describe the conventions
Hypotheses: You could be asked to write one and describe the conventions
Method: You could be asked to write one and describe the conventions
Ethics: You could be asked to write one and describe the conventions
Results: You could be asked to write one and describe the conventions
Discussion: You could be asked to describe the conventions
Referencing: You could be asked to write one and describe the conventions
Appendices: You could be asked to describe the conventions, for example, what goes in the appendices. You could also be asked to write some of the items that go in an appendix, e.g., a consent form, standardised instructions, or a debriefing form.
DESIGNING RESEARCH
TITLE:
Title of research
ABSTRACT:
A summary of the study – usually about 150 words. It includes brief highlights of each part of the research, e.g., the aims, hypothesis, and study design, as well as the results section. Reading an abstract is a lot quicker than reading a whole research paper. The idea of abstracts is so that researchers can quickly read them to see if the research is relevant.
INTRODUCTION:
The introduction has four parts.
Summary of Available Research: This section provides a brief overview of findings from prior studies in the same area of interest. It also mentions any criticisms or limitations identified in past research.
Justification: Here, the researcher explains why the study is being conducted. This could include gaps in current knowledge, practical implications, or the topic's relevance to everyday life.
Aims: The aims section outlines the study's specific objectives. It describes what the researchers hope to achieve or investigate.
Hypotheses: This part states the expected outcomes of the study, typically in the form of both an alternative (experimental) hypothesis and a null hypothesis. For more details on hypotheses, including how to write them, click here
METHOD:
A method is a recipe for what you did in your research. A good one will mean anyone can replicate your study without asking further questions.
The method is typically divided into six subsections:
Design:
Controls: For more details on how to control extraneous variables, click here
Participants:
Apparatus/ Materials
Procedure:
Ethics
SOME TEACHERS REFER TO THE METHOD AS APFC = AIMS PROCEDURES FINDINGS CONCLUSIONS
DESIGN:
A DESIGN SHOULD INCLUDE:
Choice of the method. E.g. field experiments, naturalistic observation, etc.
Choice of experimental design (if appropriate), e.g. repeated measures.
Choice of observational techniques (if appropriate), e.g. time sampling.
Identification of IV and DV (where appropriate, if an experiment).
If it involved correlation or other non-experimental methods, which co-variables were related?
YOU must operationalise IV, DV and co-variables.
CONTROLS:
Methods used to control extraneous variables, e.g., use of standardised instructions, counterbalancing, single-blind condition, random allocation of participants to conditions, keeping forms anonymous, slot boxes for anonymity, same time of day, same room temperature, etc.
PARTICIPANTS
Full details of:
• The target population is described in terms such as age, gender or other relevant variables.
• The sampling method used.
• The actual sample.
• How participants were assigned to conditions.
• Details of who was conducting the research, described in terms of age, gender or any other relevant variables.
APPARATUS AND MATERIALS
A description of all the apparatus and materials used.
The source of any questionnaires or scales used should be given, and scoring procedures should be explained.
Examples and answers should be given in the Appendix.
Copies of word lists, questionnaires, etc., should be placed in appendices.
Mark schemes for any tests or questionnaires
PROCEDURES
The researcher conducts a pilot study with ten volunteer participants from a local SEN school.
These should include a description of the steps taken in the research in sufficient detail so that someone unfamiliar with the work could repeat the study. This should include where the research was undertaken, the instructions given to participants, exactly what was done, etc. Details of what was said may be placed in an appendix. Students should ensure they include details of the control procedures already mentioned, such as how counterbalancing was achieved, how a single- or double-blind condition was implemented, how extraneous variables were controlled, etc.
ETHICS
Participant Age: All participants must be 16 or older. If not, parental/guardian consent is required to ensure legal compliance.
Physical and Psychological Safety: Participants should not be subjected to physical harm or psychological distress during the study.
Deception: Deception should be minimised. Strategies such as presumptive consent or prior general agreement can be employed to inform participants of the possibility of deception and to ensure that no harm or humiliation occurs. Full disclosure is provided during the debriefing.
Informed Consent: Participants must provide fully informed consent and sign a consent form before participating in the study, understanding the purpose, procedures, and potential risks.
Debriefing: Participants should be debriefed after the study, during which any deception is disclosed and the study's purpose and findings are explained. Participants should be allowed to ask questions and seek clarification.
Right to Withdraw: Participants can withdraw their data if they are dissatisfied or uncomfortable during the study. This right should be emphasised during the informed consent process and reiterated during debriefing.
Voluntary Participation: Participants should be informed that participation is voluntary and that they may withdraw from the study at any time without consequences.
Psychologists can navigate the ethical conundrum of deception in research through prior general agreement or presumptive consent.
Prior General Agreement: Researchers can seek general agreement from a sample group similar to the target participants. This involves outlining the general nature of the study, including the possibility of deception, to this sample group. Their agreement to participate under such conditions helps ensure the study's procedures are acceptable to a broader population.
Presumptive consent is a method in which researchers ask a similar group of participants whether they would be willing to be deceived about the hypothesis or the study's true nature. This approach assumes that individuals in this similar group would likely consent to participate, even if fully informed of the possibility of deception. It relies on the belief that participants understand the necessity of deception in certain research contexts and are willing to participate if assured of their safety and well-being.
However, it's important to note that while presumptive consent provides valuable insights into participants' likely reactions, it does not replace the need for thorough debriefing after the study. During debriefing, participants receive detailed information about the study's purpose, procedures, and findings, including any instances of deception. This ensures that participants fully understand the study's implications and can confirm consent retroactively.
Socially sensitive research (SSR) involves studies on topics that could have significant societal impact and may cause distress, stigma, or discrimination for individuals or groups, such as research on race, gender, sexuality, or mental health. It requires researchers to carefully consider the ethical implications, including how findings might be misinterpreted, misused, or affect vulnerable populations, necessitating careful handling of data and communication of results.
RESULTS
FOR DETAILED INFORMATION, PLEASE SEE THE SECTIONS ON DESCRIPTIVE STATISTICS AND
The results in a research paper are a brief description of the findings, usually presented by measures of central tendency and dispersion displayed in tables or graphs, followed by analysis and then inferential statistics to determine the probability of the results occurring again.
The result section is split into two sections: Descriptive statistics AND Inferential statistics:
DESCRIPTIVE STATISTICS: Measures of central tendency, dispersion and percentages displayed in graphs and tables
Once data has been collected, it is essential to summarise it numerically. This quantitative summary, called descriptive statistics, allows researchers to view the data as a whole.
Descriptive statistics are a crucial tool for transforming raw data into a format that is easier to comprehend and interpret. Raw data, consisting of individual data points or values, can be overwhelming and difficult to interpret directly. Descriptive statistics concisely summarise this raw data, allowing researchers to understand key characteristics such as central tendency, variability, and distribution. By organising and summarising the data, descriptive statistics make it more accessible and enable researchers to draw meaningful insights and conclusions from the dataset. In essence, descriptive statistics serve as a bridge between raw data and actionable insights, facilitating data analysis and interpretation.
Additionally, descriptive statistics include measures of dispersion, such as the range, variance, and standard deviation, which quantify the spread or variability of data points around the central tendency. Moreover, descriptive statistics may also include percentages, offering insights into the proportion of data falling within specific categories or ranges. These statistics are selected based on the nature of the collected data and are essential for conveying the dataset's overall characteristics to researchers and readers alike.
INFERENTIAL STATISTICS: Statistical test choices and results. Rejection or acceptance of the null hypothesis.
However, it's important to note that descriptive statistics only summarise the data; they do not assess the probability that the results occurred by chance. Therefore, while descriptive statistics can indicate whether a study has successfully collected and summarised data, they do not determine whether the hypothesis can be rejected. Researchers need to conduct inferential statistical tests to assess the likelihood that the observed results would occur again and determine whether the hypothesis can be rejected.
Below is how the inferential results section in a research paper:
The critical value of T for N =20 for a one-tailed test where p ≤=0.05 is 60. As the observed value of T (29.5) is less than the critical/table value, the likelihood of my results occurring by chance is less than 5% (p ≤ 0.05). Therefore, I can reject my Null hypothesis and accept my experimental hypothesis.
DISCUSSION
Note, there are four parts to a discussion. You could be asked about this in the examination. A typical question could be: “What are the conventions for a discussion?”
Researchers offer some explanations for what they have found,
Considers the theory in light of results and past research (what does it tell us?
Consider the limitations of their study.
Offer ideas for future research (how does the research apply to the real world? What research can we do next?.
DISCUSSION IN MORE DETAIL:
Researchers offer some explanations for what they have found:
In this part of the discussion, researchers interpret their findings and provide explanations grounded in theory and prior research. They analyse the data collected and explain why certain results were obtained. For example, suppose the results indicate a significant reduction in stress levels among participants in the mindfulness intervention group compared to the control group. In that case, researchers may theorise that mindfulness meditation promotes relaxation and reduces physiological arousal, thereby lowering stress levels. They may also draw on existing stress-reduction and mindfulness theories to support their interpretations.
Considers results given theory and past research:
Researchers contextualise their findings within the broader theoretical framework and existing literature. They discuss how their results align with or diverge from previous studies and theories. For instance, if prior research has consistently demonstrated the stress-reducing effects of mindfulness meditation, the current study's findings would corroborate these findings and contribute to the cumulative knowledge in the field. On the other hand, if the results contradict previous research, researchers may explain the discrepancies and propose potential reasons for the divergent findings.
Consider the limitations of their study:
Researchers critically evaluate the strengths and weaknesses of their study, acknowledging any limitations that may have influenced the results. This could include sample size, research design, measurement tools, or methodological constraints. For example, if the study had a small sample size or used self-reported measures of stress, researchers would acknowledge these limitations and discuss how they may have affected the validity or generalizability of the findings. By acknowledging limitations, researchers demonstrate transparency and integrity in their research process.
Offer ideas for future research:
Finally, researchers suggest avenues for future research based on the current study's findings. They may propose follow-up studies to address unanswered questions or to explore new research questions that emerge from their findings. For instance, if the current study found a significant reduction in stress levels among college students following a mindfulness intervention, researchers may recommend longitudinal studies to assess the long-term effects of mindfulness meditation on stress reduction. Additionally, they may suggest investigating the mechanisms underlying the observed effects or exploring the impact of mindfulness interventions on other aspects of mental health and well-being. By offering ideas for future research, researchers contribute to advancing knowledge in the field and guide researchers interested in building upon their work.
REFERENCES
A reference list and a bibliography are sources cited in a document, but serve different purposes.
Differences between bibliographies and references:
References:
A reference is primary data that represents the source of information cited in a research paper.
It is a critical component of scholarly communication, ensuring transparency and accountability in the research process.
References are expected to provide accurate and detailed information about the source material, including authorship, publication date, and journal or publisher information.
They allow readers to trace the origins of ideas or findings and verify the evidence presented in the paper.
Properly executed references enable readers to locate the original research paper and assess its credibility and relevance.
Bibliographies:
Bibliographies typically include secondary sources, such as books or review articles, which may reference primary research.
Unlike references, which focus on primary sources, bibliographies may include a broader range of materials consulted during the research process, regardless of whether they were directly cited in the paper.
While bibliographies provide additional reading or contextualise the topic, they may not always provide the same level of detail or accuracy as references.
Books included in bibliographies may become outdated or go out of print, potentially causing the original research they cite to be lost.
Unlike references, which are crucial for establishing the credibility and integrity of scholarly work, bibliographies may not always provide direct links to primary sources.
WRITING REFERENCES FOR A PSYCHOLOGY PAPER
For a psychology journal article, a reference typically follows a specific format:
Author(s)’ last name, followed by initials. Year of publication in parentheses. Title of the article. Name of the journal in italics. Volume number (issue number if available), followed by the page range. DOI (Digital Object Identifier) or URL (if available).
For example:
Smith, J. A., & Johnson, L. B. (2019). The effects of mindfulness meditation on stress reduction. Journal of Applied Psychology, 25(3), 123-135. DOI: 10.1080/12345678.2019.1234567 This format provides readers with all the necessary information to locate and verify the source.
APPENDICES
Appendix: singular / Appendices: plural
APPENDIX: The place where you put things that would disturb the ‘flow’. If you are writing a psychology paper for a class or publication, you may be required to include an appendix. An appendix is found at the end of a paper and contains information that supplements the text, but that is too unwieldy or distracting to include in the main body of the paper.
A copy of the advert or information is given when recruiting participants
Copies of consent forms,
Standardised instructions
One copy of the questionnaire/ scale/ material used
The source of any questionnaires or scales used should be given
The scoring procedures must be explained; for example, include mark schemes for tests or questionnaires.
Examples and answers should be given.
Copies of operationalised word lists, questionnaires, and related materials should be placed in the appendices.
Raw data
Debriefing
IMPORTANT!!!!!!!!!!! You could be asked to write an aim, consent form, debriefing form, hypothesis, and method or results section. These marks are worth a lot more. When writing a method or results section, the marks can be as high as 12 marks. Please see the appendices section for advice. CLICK HERE to get advice on how to write them
RESEARCH PAPER LABORATORY EXPERIMENT
TITLE: The Effect of Physical Exercise on Attractiveness Ratings of the Opposite Sex
ABSTRACT SECTION OF PSYCHOLOGICAL RESEARCH
This study investigated whether physical exercise influences perceptions of attractiveness. Previous research suggests that physiological arousal may sometimes be misattributed to attraction. It was hypothesised that female participants who jogged for ten minutes before viewing photographs of males would give significantly higher attractiveness ratings than participants who did not exercise. An experiment using an independent groups design was conducted. Female participants were randomly allocated to either a jogging condition or a non-jogging condition. Participants in the jogging condition jogged in place for ten minutes before rating photographs of males on a scale from 1 to 10. Participants in the control condition completed the rating task without exercising. The mean attractiveness rating for the jogging condition was 6.5, compared with 6.4 for the non-jogging condition. Statistical analysis revealed no significant difference between the groups. Therefore, the findings did not support the hypothesis. The results suggest that a brief period of exercise did not significantly influence perceptions of attractiveness in this study.
INTRODUCTION SECTION OF PSYCHOLOGICAL RESEARCH
SUMMARY OF AVAILABLE RESEARCH: Psychologists have long been interested in the factors that influence interpersonal attraction. One explanation is the misattribution of arousal theory, which suggests that people may mistake physiological arousal for feelings of attraction. Research has shown that when individuals experience an increased heart rate and other signs of arousal, they may be more likely to perceive others as attractive. However, some studies have been criticised for using artificial laboratory settings and small sample sizes, making it difficult to generalise the findings to everyday situations.
JUSTIFICATION: This study was conducted to investigate whether physical exercise can influence perceptions of attractiveness. Understanding the factors that affect attraction is important because attraction plays a significant role in social relationships and everyday interactions. Furthermore, there is limited research examining whether a brief period of exercise influences attractiveness ratings, making this an area worthy of further investigation.
AIMS: The aim of this study was to investigate whether female participants who jog for ten minutes give higher attractiveness ratings to photographs of males than female participants who do not exercise before completing the rating task.
HYPOTHESES: EXPERIMENTAL HYPOTHESIS (DIRECTIONAL / ONE-TAILED) Female participants who jog for ten minutes will give significantly higher attractiveness ratings to photographs of males than female participants who do not exercise beforehand.
NULL HYPOTHESIS: There will be no significant difference in the attractiveness ratings given to photographs of males by female participants who jog for ten minutes and female participants who do not exercise beforehand.
DESIGN SECTION OF PSYCHOLOGICAL RESEARCH
The study used an experimental method with an independent groups design.
The aim of the study was to investigate whether physiological arousal affects attraction.
The independent variable (IV) was physiological arousal. This was operationalised by having participants jog on the spot for 10 minutes before completing the task. A control condition was included in which participants did not undertake any exercise.
The dependent variable (DV) was attraction. This was operationalised as participants' ratings of photographs of the opposite sex on an attractiveness scale from 1 to 10.
Participants were randomly allocated to either the physiological arousal condition or the control condition.
CONTROLS
STANDARD CONTROL PROCEDURES
Standardised instructions were given to all participants.
Participants were randomly allocated to conditions.
All participants completed the study individually.
All participants used the same rating scale.
Participants were given the same amount of time to complete the task.
To control for environmental influences on attractiveness ratings:
The study took place in the same room.
Testing was conducted at approximately the same time of day.
Noise levels, room temperature and lighting were kept as consistent as possible throughout data collection
CONTROLS SPECIFIC TO THE STUDY
To ensure that attractiveness ratings were influenced by physiological arousal rather than differences in the photographs, all photographs were carefully standardised. Each photograph had:
A plain white background.
The same size and resolution.
Similar lighting conditions.
A neutral facial expression.
The same head-and-shoulders format.
No accessories such as hats, jewellery or sunglasses.
To ensure that participants in the physiological arousal condition experienced a similar level of exercise:
All participants jogged on the same treadmill.
The treadmill was set to the same speed for all participants.
Participants jogged for exactly ten minutes.
Ratings were completed immediately after jogging to ensure that physiological arousal was still present.
To control for order effects:
Photographs were presented in the same order for all participants.
PARTICIPANTS
A total of 48 participants took part in the study, consisting of 24 males and 24 females aged between 16 and 18 years. Participants were recruited from a sixth-form college in South London using a volunteer sample. Posters advertising the study were displayed in student common rooms, inviting athletic students to participate. Those who responded to the advertisement were included in the sample. Participants were randomly allocated to one of two conditions in an independent groups design. Each participant was assigned a number, which was then entered into an online random number generator. Participants allocated an odd number were placed in the jogging condition, whilst those allocated an even number were placed in the non-jogging condition. This ensured that each participant had an equal chance of being assigned to either condition, reducing allocation bias. As a result, 24 participants were allocated to the jogging condition and 24 to the non-jogging condition.
The research was conducted by a female researcher aged 18 years.
MATERIALS/APPARATUS
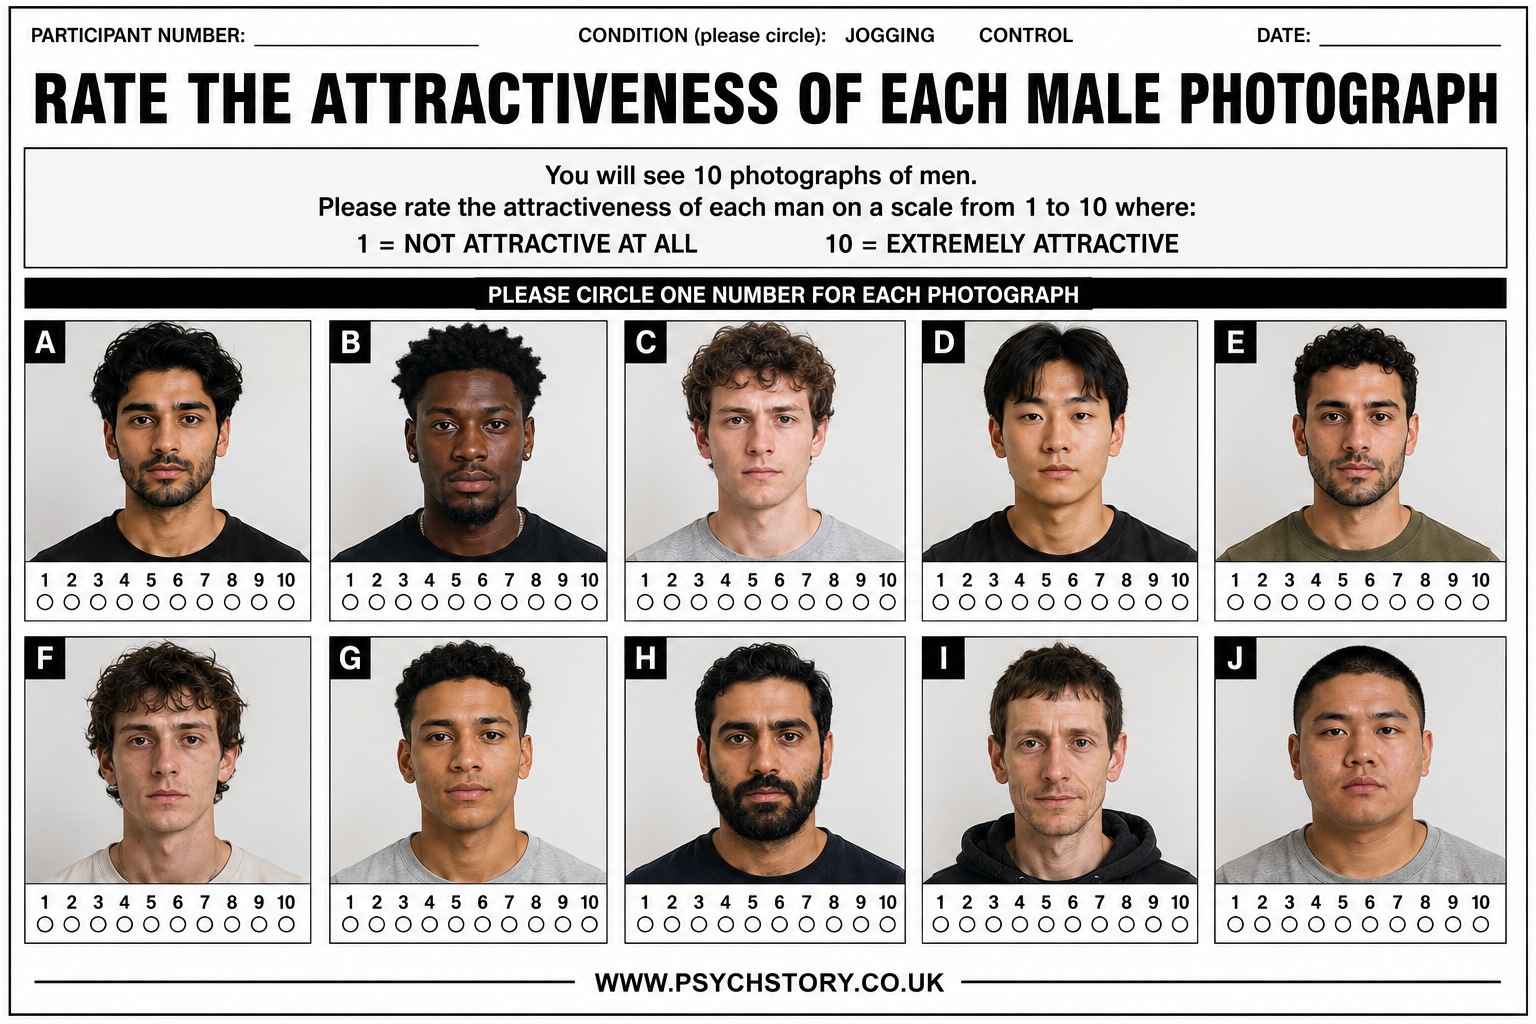
• A stimulus sheet containing a series of photographs of members of the opposite sex with an attractiveness rating scale beneath each photograph, ranging from 1 (very unattractive) to 10 (very attractive), on which participants recorded their responses (see Appendix A).
• Black ink pens.
• Treadmill.
• Stopwatch.
•Table and chair
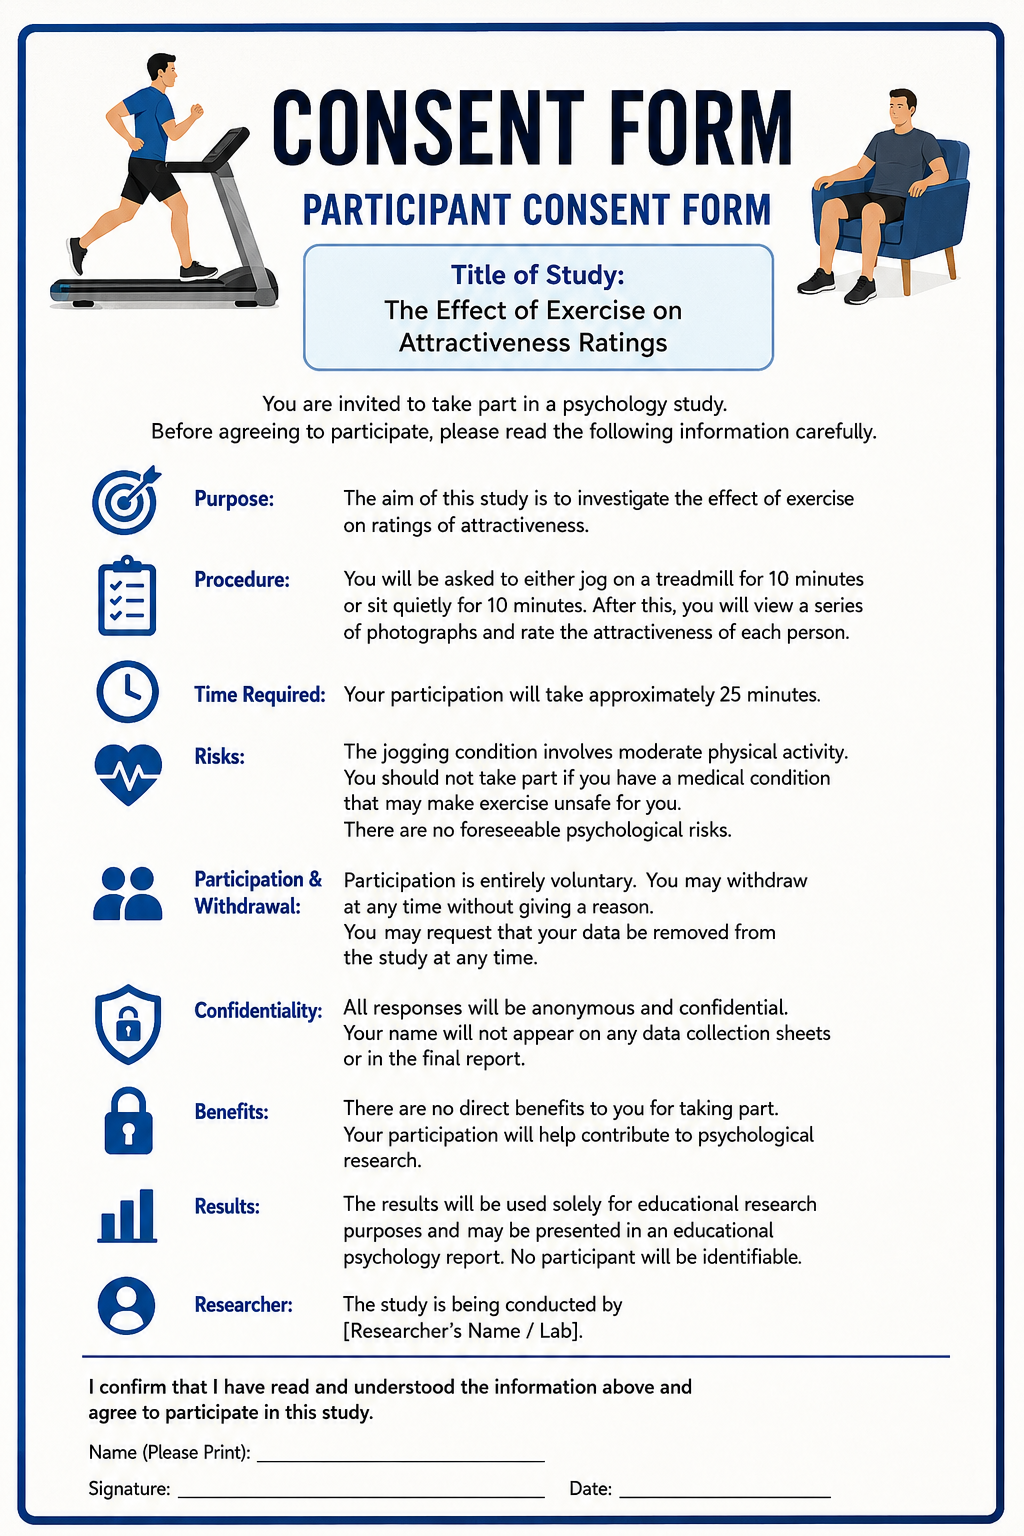
• Participant consent form (see Appendix B).
• Standardised written instructions (see Appendix C).
• Debriefing sheet (see Appendix D).
• Scoring guide/mark scheme for the attractiveness rating scale (see Appendix E).
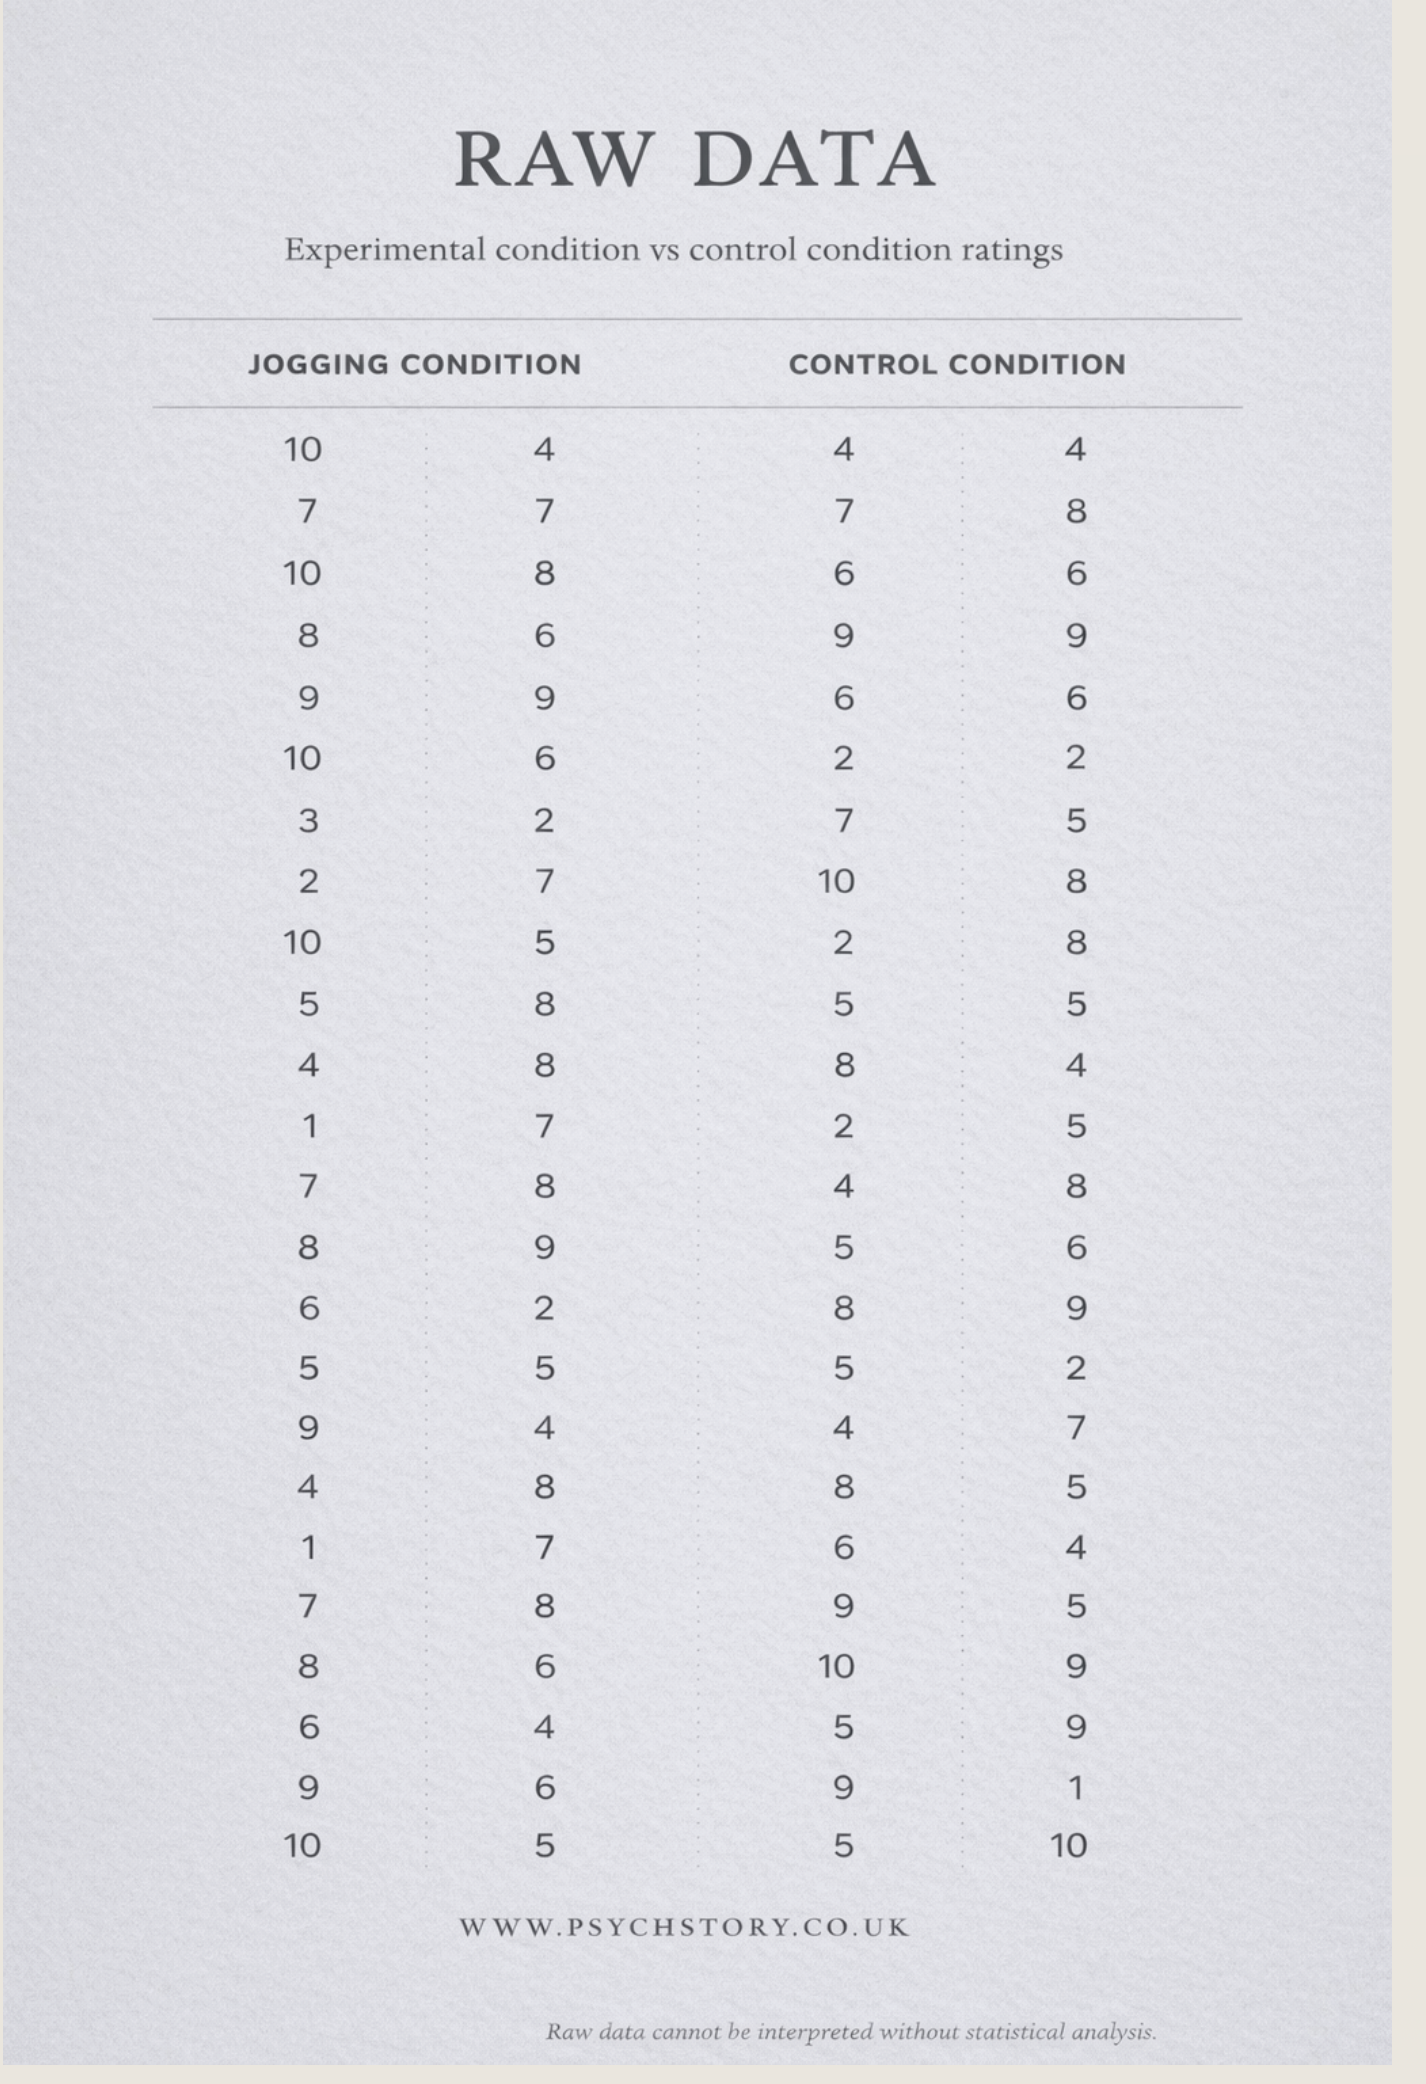
• Raw data (see Appendix F)
PROCEDURE
Participants were recruited using a volunteer sample. Posters advertising the study were displayed in student common rooms at a sixth form college in South London.
Participants who volunteered to take part were provided with an information sheet and consent form before the study began.
Participants were assigned a unique identification number.
Each identification number was entered into an online random number generator.
Participants allocated an odd number were assigned to the jogging condition, whilst participants allocated an even number were assigned to the non-jogging condition. Twenty-four participants were allocated to each condition.
Participants in the jogging condition exercised on a treadmill for ten minutes at a speed of 7 km/h (4.3 mph).
Following the allocation, all participants completed the attractiveness rating task individually in a quiet room.
Participants were provided with the same stimulus sheet containing photographs of members of the opposite sex.
Beneath each photograph was an attractiveness rating scale ranging from 1 (very unattractive) to 10 (very attractive).
Participants rated the attractiveness of each photograph by recording a score on the scale provided.
Participants were given ten minutes to complete the task.
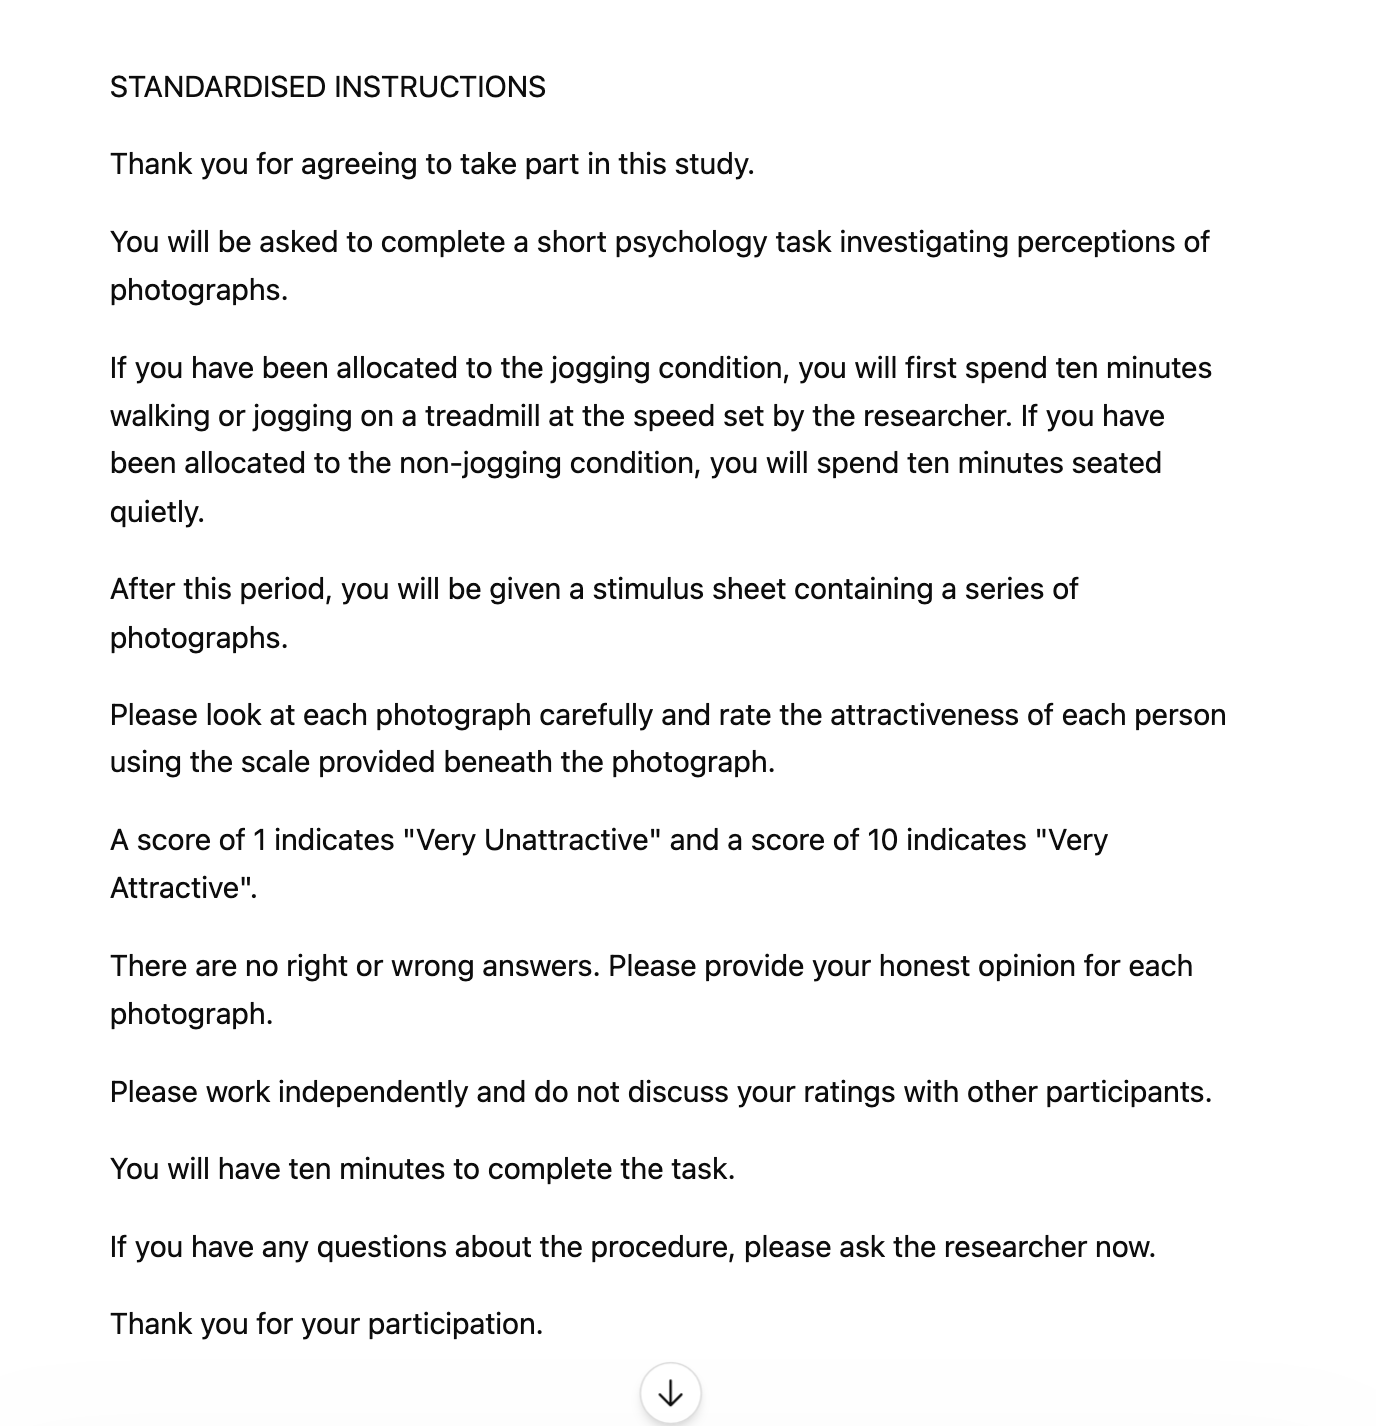
Standardised written instructions were provided to all participants to ensure that the procedure was administered consistently.
The researcher remained present throughout the investigation to answer procedural questions and ensure that instructions were followed correctly.
Participants' responses were collected and recorded on a raw data sheet.
Upon completion of the study, participants received a debriefing sheet and were reminded of their right to withdraw their data.
The data were collated and analysed using descriptive statistics and a Mann-Whitney U test
ETHICS
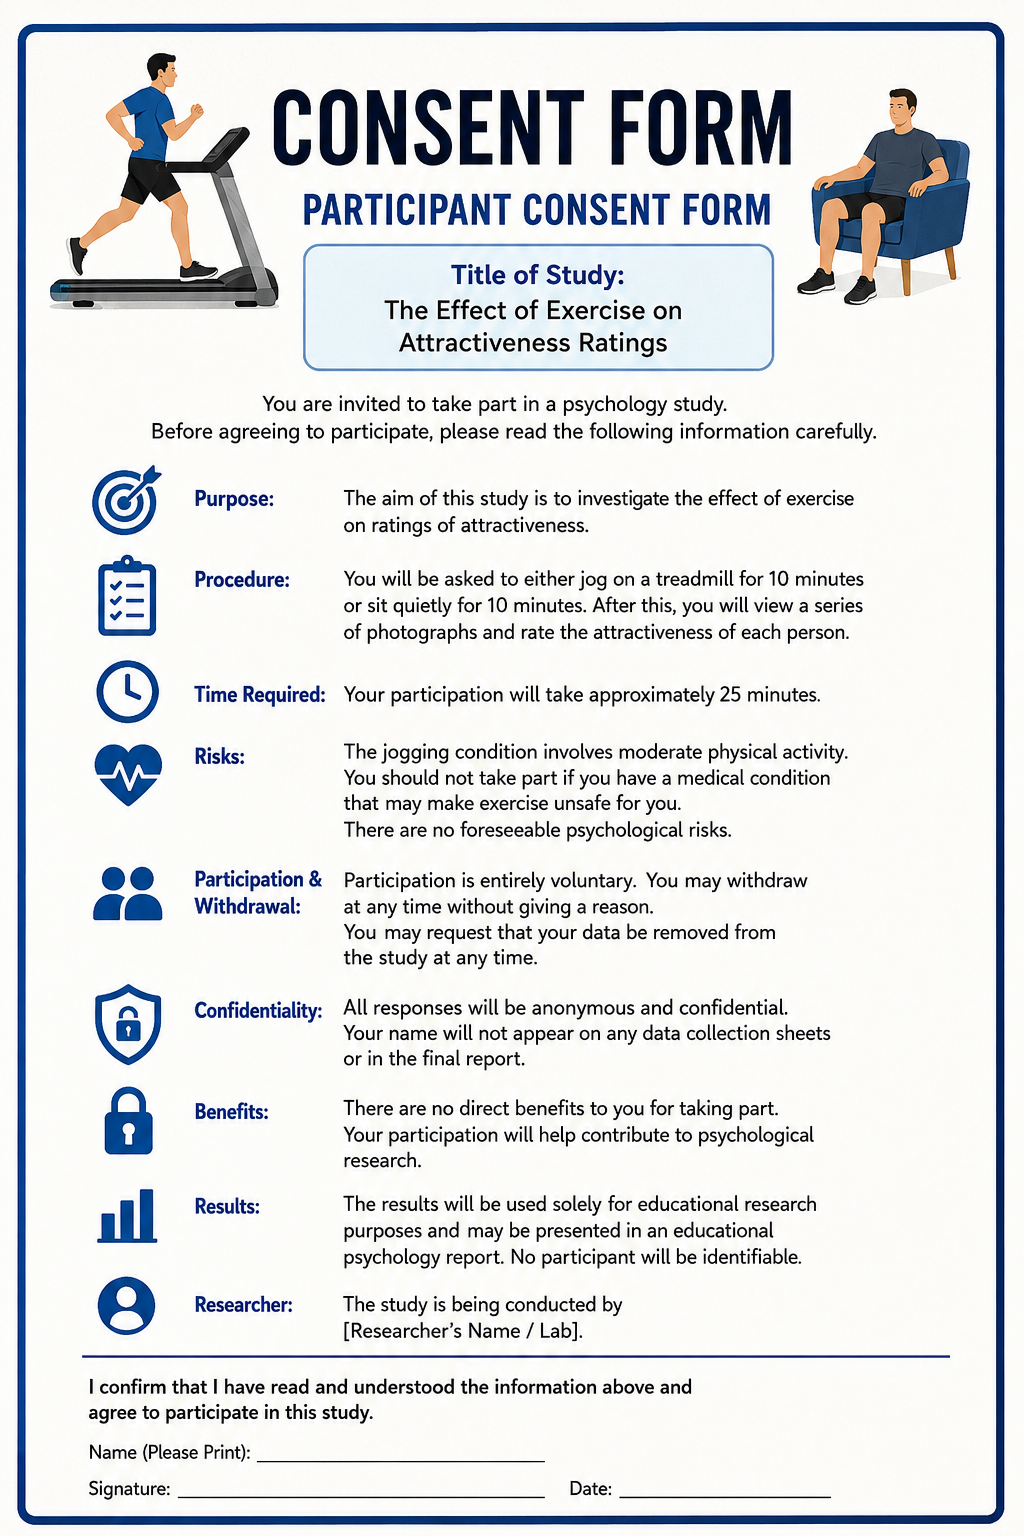
Participants were provided with a consent form before taking part in the study.
Participants were informed that participation was voluntary and that they could withdraw from the study at any time without penalty.
Standardised written instructions were provided to ensure that all participants understood what participation involved before giving consent.
Participants were aged between 16 and 18 years and were therefore considered competent to provide informed consent.
Participants were protected from physical harm. The treadmill was set to a moderate speed of 7 km/h for 10 minutes, and participants could stop exercising at any time if they felt uncomfortable.
Participants were protected from psychological harm. The task involved rating photographs of members of the opposite sex and was not expected to cause distress, embarrassment or discomfort.
Participants' responses remained anonymous and confidential throughout the investigation.
Any deception used in the study was minimal. Participants were not informed of the precise hypothesis before taking part in order to reduce demand characteristics and increase the validity of the findings.
Upon completion of the study, participants received a debriefing sheet explaining the true aim of the investigation.
Participants were given the opportunity to ask questions during the debriefing process and were reminded of their right to withdraw their data if they no longer wished it to be included in the study
RESULTS SECTION OF PSYCHOLOGICAL RESEARCH
DESCRIPTIVE STATISTICS
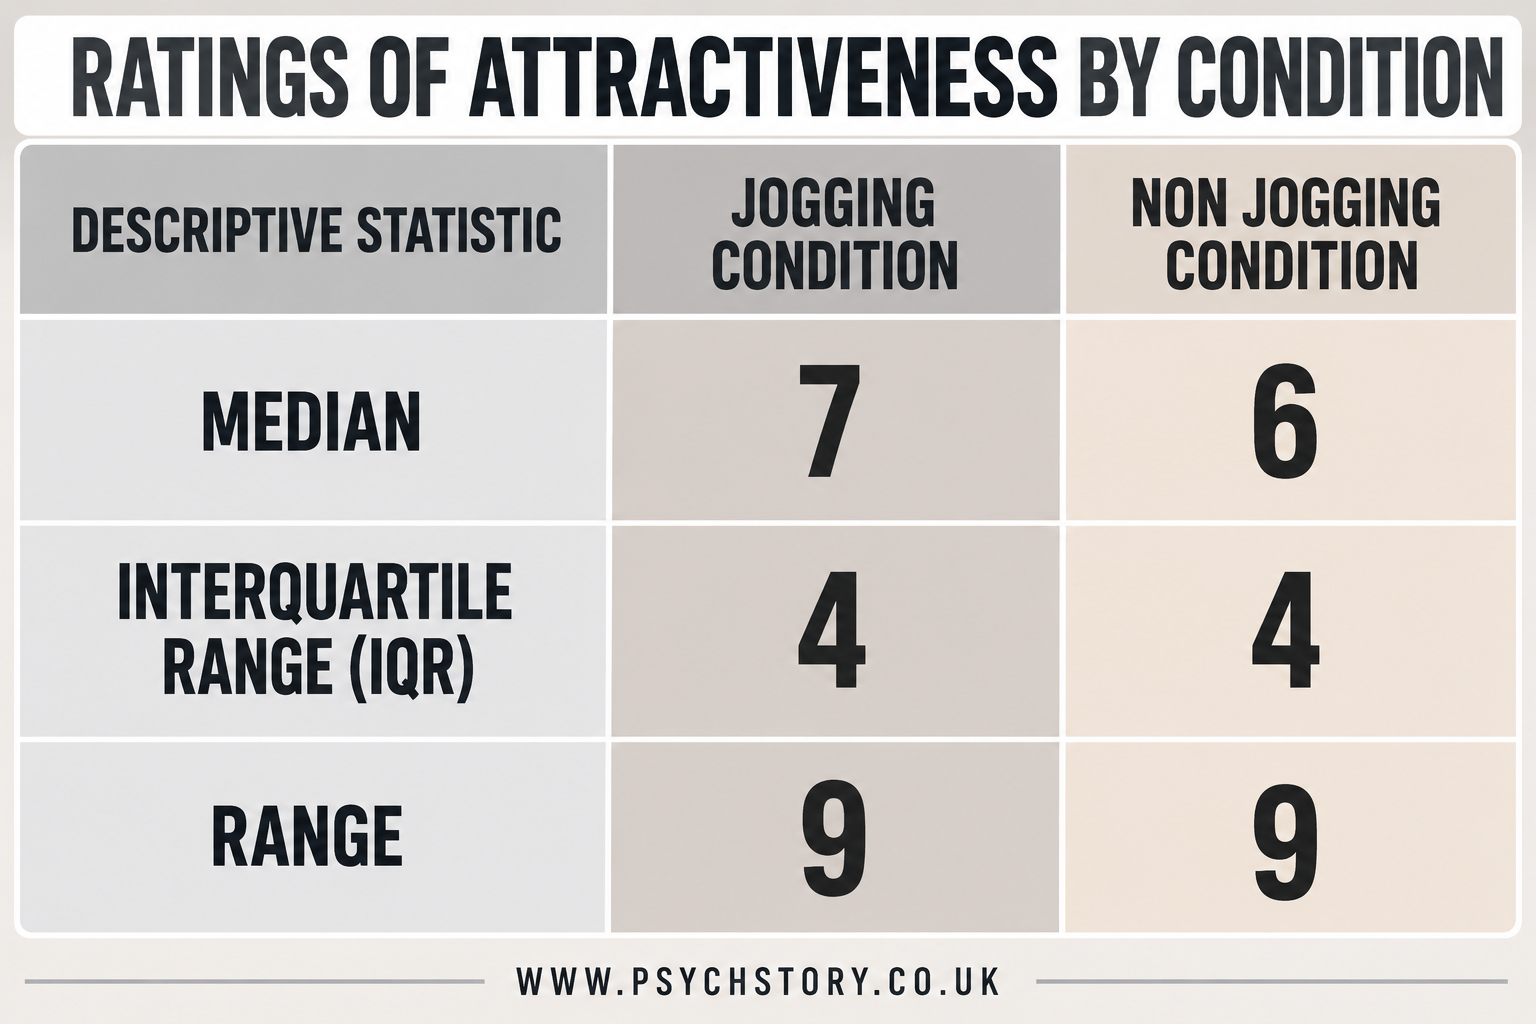
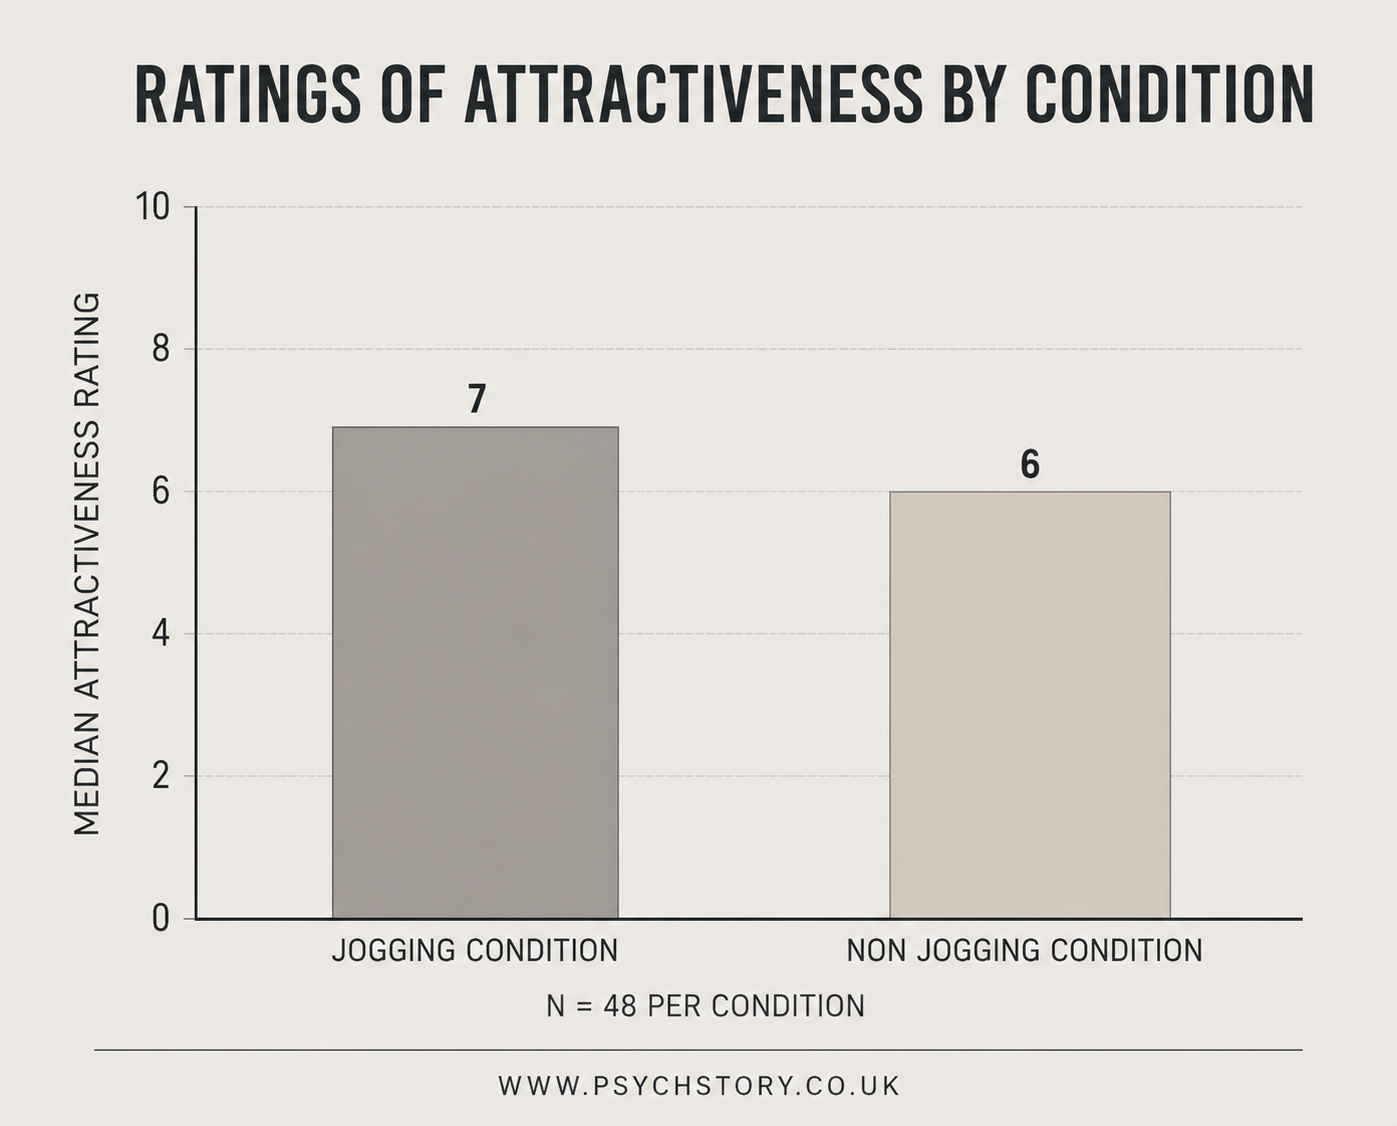
.
SUMMARY OF DESCRIPTIVE STATISTICS
The descriptive statistics suggest only a small difference between the two conditions. Participants in the jogging condition produced a slightly higher median attractiveness rating (Median = 7) than participants in the non-jogging condition (Median = 6). This suggests that participants who experienced physiological arousal tended to give marginally higher ratings of attractiveness. The range was identical in both conditions (Range = 9), indicating that scores were spread across a similarly wide section of the rating scale. The interquartile range was also identical in both conditions (IQR = 4), suggesting that the middle 50% of scores showed the same degree of variability.
Overall, the descriptive statistics suggest a slight tendency for participants in the jogging condition to rate others as more attractive. However, the similarity of the ranges and interquartile ranges indicates that the overall pattern and spread of scores were very similar across the two groups. Based on the descriptive statistics alone, the effect of physiological arousal appears to be weak.
To determine whether this observed difference was genuine or simply due to chance variation within the sample, inferential statistics were subsequently conducted.
INFERENTIAL STATISTICS AND THE RATIONALE FOR CHOICE OF TEST
At the 5% level of significance, the critical table value for a one-tailed test when N = 48 is 928. Since the observed value of U is 1254.5, which is greater than the critical value, the experimental hypothesis is rejected, and the null hypothesis is accepted
NOTES
A Mann–Whitney U test would be used to analyse the data.
This test was chosen because:
The study used an independent-groups design, with participants in either a jogging or a non-jogging condition.
The dependent variable (attractiveness ratings) is measured at an ordinal level, as the 1–10 scale provides ranked data rather than equal-interval measurements. As a result, the data cannot be assumed to follow a normal distribution.
Because the data are ordinal, a non-parametric test is appropriate.
The research hypothesis is directional (one-tailed), predicting higher attractiveness ratings following jogging.
A significance level of p ≤ 0.05 would be used to determine whether any observed difference between the two conditions is statistically significant.
If the calculated value of U is equal to or less than the critical value at the 0.05 level, the null hypothesis would be rejected. If the value is greater than the critical value, the null hypothesis would be retained.
DISCUSSION
The aim of this study was to investigate whether physiological arousal influences attractiveness ratings. It was hypothesised that participants who had engaged in physical exercise would rate members of the opposite sex as more attractive than participants who had not exercised.
The descriptive statistics provided limited support for the hypothesis. Participants in the jogging condition produced a slightly higher median attractiveness rating (Median = 7) than participants in the non-jogging condition (Median = 6). However, the difference between the two groups was small. Furthermore, both groups produced identical ranges (Range = 9) and interquartile ranges (IQR = 4), suggesting that the distribution and variability of scores were very similar across conditions.
To determine whether this difference was statistically significant, a Mann-Whitney U test was conducted. The results were not significant at the 5% level. Therefore, the null hypothesis was accepted, and the experimental hypothesis was rejected. This suggests that any difference observed between the jogging and non-jogging conditions was likely due to chance rather than the manipulation of physiological arousal.
One possible explanation for these findings is that the level of physiological arousal produced by the treadmill exercise may not have been sufficient to influence participants' perceptions of attractiveness. Whilst participants exercised for ten minutes at 7 km/h, this level of exercise may not have produced the degree of arousal necessary to affect attraction judgements. Individual differences in fitness may also have influenced the manipulation's effectiveness, with some participants experiencing greater physiological arousal than others.
The findings do not support the theory of misattribution of arousal proposed by Schachter and Singer (1962). According to this explanation, individuals may mistakenly attribute physiological arousal caused by one source to another stimulus in the environment. In the present study, participants who experienced physiological arousal did not rate members of the opposite sex significantly more positively than those in the control condition. This suggests that physiological arousal alone may not be sufficient to increase perceived attractiveness, at least under the conditions used in this investigation.
One limitation of the study is that attractiveness was measured using a self-report rating scale. Such measures may be affected by social desirability bias, with participants providing responses they believe are socially acceptable rather than their genuine opinions. In addition, attractiveness is highly subjective and may be influenced by personal preferences that were not controlled within the study.
A second limitation is that the sample consisted entirely of students aged 16 to 18 from a single sixth form college in South London. This reduces population validity because the findings may not generalise to older adults or individuals from different cultural and educational backgrounds.
Future research could increase the intensity or duration of the exercise manipulation to produce a stronger level of physiological arousal. Researchers could also use a larger and more diverse sample to improve the generalisability of the findings. Finally, future studies could investigate whether physiological arousal affects other aspects of attraction, such as willingness to interact with a person, rather than relying solely on attractiveness ratings.
In conclusion, the results suggest that physiological arousal had little effect on attractiveness ratings in this sample. Although participants in the jogging condition produced slightly higher ratings, the difference was not statistically significant and may have occurred by chance.
REFERENCES
APPENDICES
CONSENT FORM
STANDARDISED INSTRUCTIONS
ATTRACTIONS SCALE
MARK SCHEME
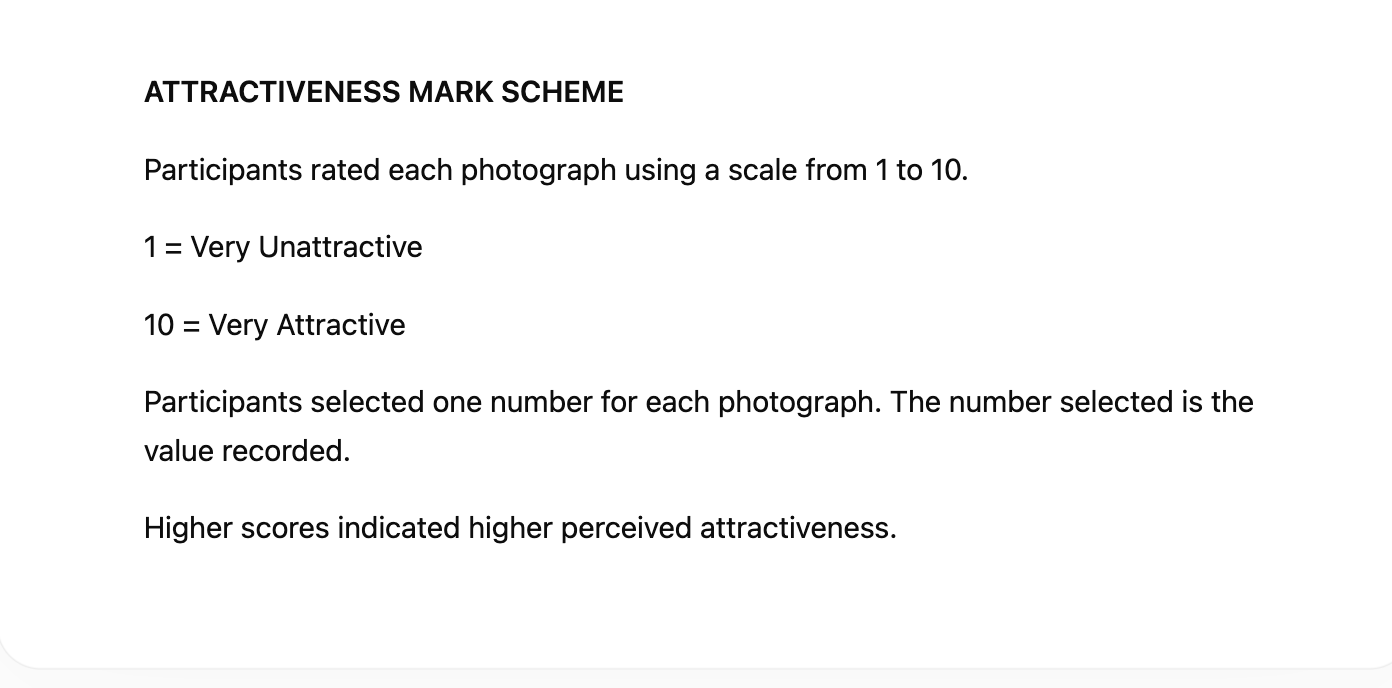
e.
RAW DATA
DEBRIEFING FORM
RESEARCH PAPER: EXAMPLE CORRELATION
INTRODUCTION
Psychologists have long been interested in the role that physical attractiveness plays in romantic relationships. One influential explanation is the Matching Hypothesis, proposed by Walster et al. (1966). The Matching Hypothesis suggests that individuals are most likely to form and maintain relationships with partners who are similar to themselves in physical attractiveness. Rather than seeking the most attractive partner available, people tend to make realistic choices that maximise the likelihood of acceptance and relationship success whilst minimising the risk of rejection.
Research generally supports the idea that couples tend to be similar in levels of physical attractiveness. However, much of this research was conducted several decades ago, before the widespread use of social media, online dating applications and image-based platforms. Modern society places a much greater emphasis on physical appearance than in the past, exposing individuals to a constant stream of highly attractive images and potentially altering expectations about romantic partners.
Consequently, it is important to investigate whether the Matching Hypothesis continues to explain relationship formation in contemporary society. This study examined the relationship between the physical attractiveness of members of real romantic couples observed in a natural setting.
JUSTIFICATION
The study was conducted because modern society is increasingly appearance-focused. Social media, advertising and online dating platforms expose individuals to highly curated images of attractiveness on a daily basis. As a result, it is important to determine whether people continue to form relationships with partners of similar attractiveness, as predicted by the Matching Hypothesis, or whether modern cultural influences have altered relationship patterns.
AIM
The aim of this study was to investigate whether individuals in romantic relationships are matched for physical attractiveness, as predicted by the Matching Hypothesis.
EXPERIMENTAL HYPOTHESIS (DIRECTIONAL): There will be a significant positive correlation between the attractiveness ratings of individuals in romantic relationships. Individuals rated as highly attractive tend to have partners rated as highly attractive, whilst those rated as less attractive tend to have partners rated as less attractive.
NULL HYPOTHESIS: There will be no significant correlation between the attractiveness ratings of individuals in romantic relationships. Any observed relationship between partners' attractiveness ratings will be due to chance
METHOD
DESIGN
The study used a correlational research method. This was appropriate because the aim was to investigate whether there was a relationship between the attractiveness ratings of two naturally occurring variables: one partner’s attractiveness rating and the other partner’s attractiveness rating.
The study was not an experiment because the researcher did not manipulate an independent variable. Participants were already in romantic relationships, so the researcher measured the attractiveness ratings of both partners and examined whether the two scores were related.
The co-variables were:
Partner A’s attractiveness rating.
Partner B’s attractiveness rating.
Attractiveness was operationalised using a rating scale from 1 to 10, where 1 represented very unattractive and 10 represented very attractive.
A positive correlation was predicted. This means that as one partner’s attractiveness rating increased, the other partner’s attractiveness rating was also expected to increase.
The data were ordinal because attractiveness was measured using rating scales. Therefore, Spearman’s rho would be the most appropriate inferential statistical test.
CONTROLS
STANDARD CONTROL PROCEDURES
• All participants were given the same standardised script explaining the nature of the study.
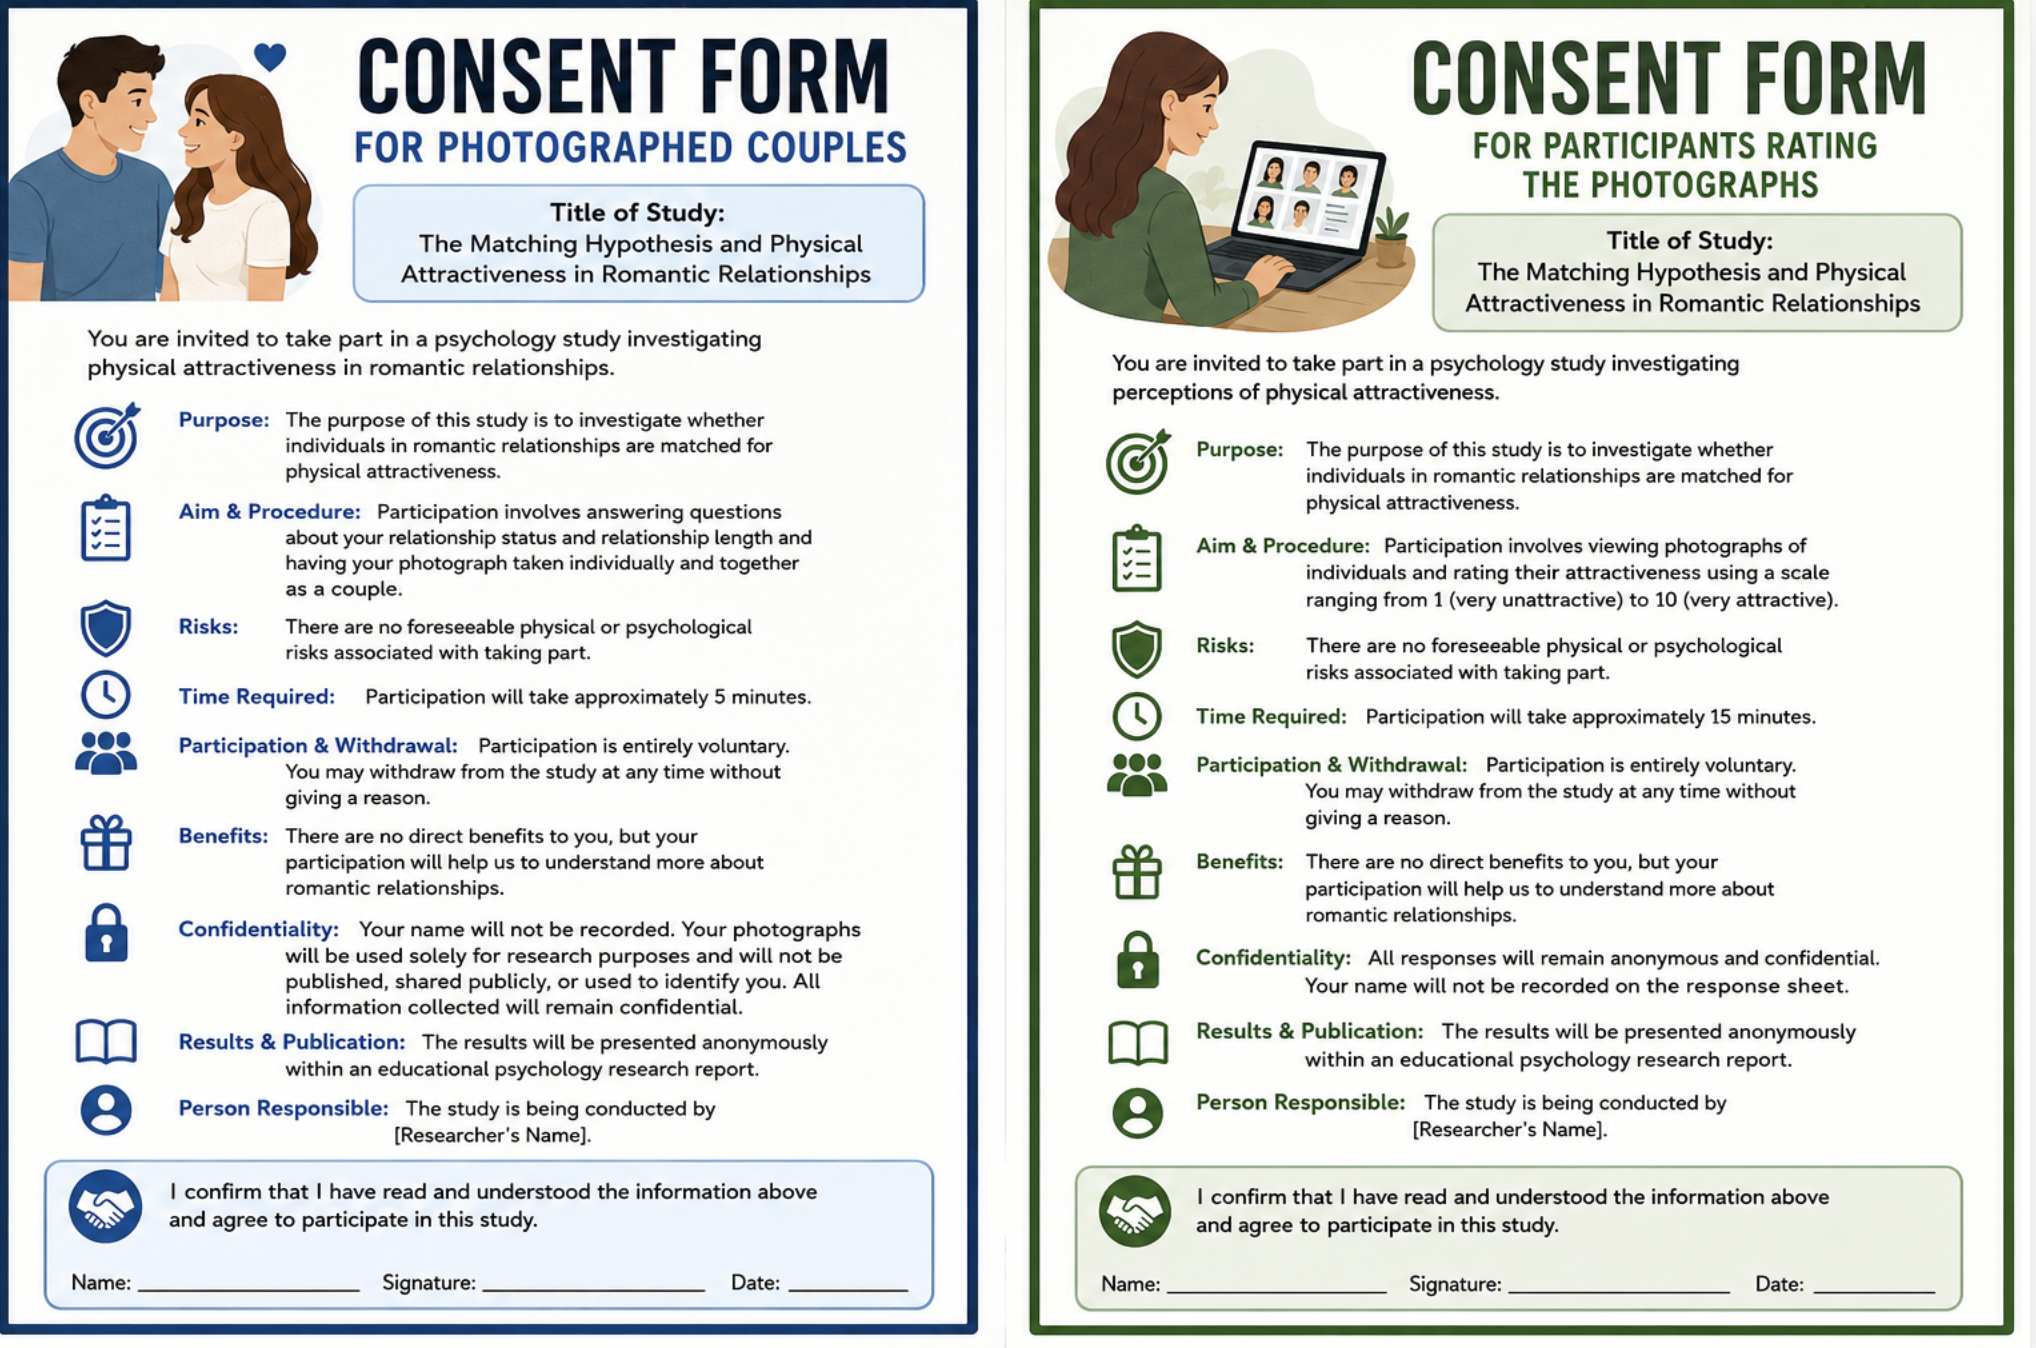
• All participants completed the same consent form.
• All participants were assured that their photographs and individual results would remain confidential and anonymous.
SPECIFIC CONTROLS
• All participants were photographed using the same camera.
• All photographs were taken in the same location.
• Lighting conditions were kept as consistent as possible.
• All photographs were taken against the same background.
• All participants were asked to maintain a neutral facial expression.
• All participants were asked to remove hats, sunglasses and other accessories that could influence attractiveness ratings.
• All photographs were cropped to the same head and shoulders format.
• All attractiveness ratings were completed using the same 1 to 10 rating scale.
• Standardised instructions were provided to all raters.
• The order of photographs was standardised for all raters.
PARTICIPANT CONTROLS
• Only couples who confirmed that they were in a romantic relationship were included in the study.
• Only couples who had been dating for less than two years were included. This helped ensure that attractiveness ratings reflected relatively recent partner selection.
• Couples were photographed separately and together. The separate photographs allowed each partner's attractiveness to be rated independently, whilst the couple photograph confirmed that the two participants were in a relationship.
• Independent raters were not informed which individuals were members of the same couple. This reduced rating bias.
• The same number of attractiveness ratings was obtained for every participant.
PARTICIPANTS
• Target population: Adults currently visiting Times Square, New York.
• Sample size: 50 participants.
• Gender: 25 males and 25 females.
• Age range: 18 years and above.
• Sampling method: Opportunity sampling.
• Recruitment procedure: Researchers approached members of the public in Central Park, New York, and invited them to participate in a study investigating perceptions of attractiveness.
• The research was conducted by one male and one female researcher aged between 25-30. .
STIMULUS MATERIALS
• Photographs were collected from 50 romantic couples in Times Square, New York.
• Only couples who confirmed that they were in a romantic relationship and had been dating for less than two years were included.
• Each partner was photographed individually and as part of a couple photograph.
• The individual photographs were used to create the stimulus sheet shown to participants.
APPARATUS AND MATERIALS
• Digital camera.
• Standardised photography area with a plain background.
• Consent form (see Appendix A).
• Standardised participant script (see Appendix B).
• Standardised instructions for attractiveness raters (see Appendix C).
• Photographs of each participant taken individually (see Appendix D).
• Photographs of each couple taken together (see Appendix E).
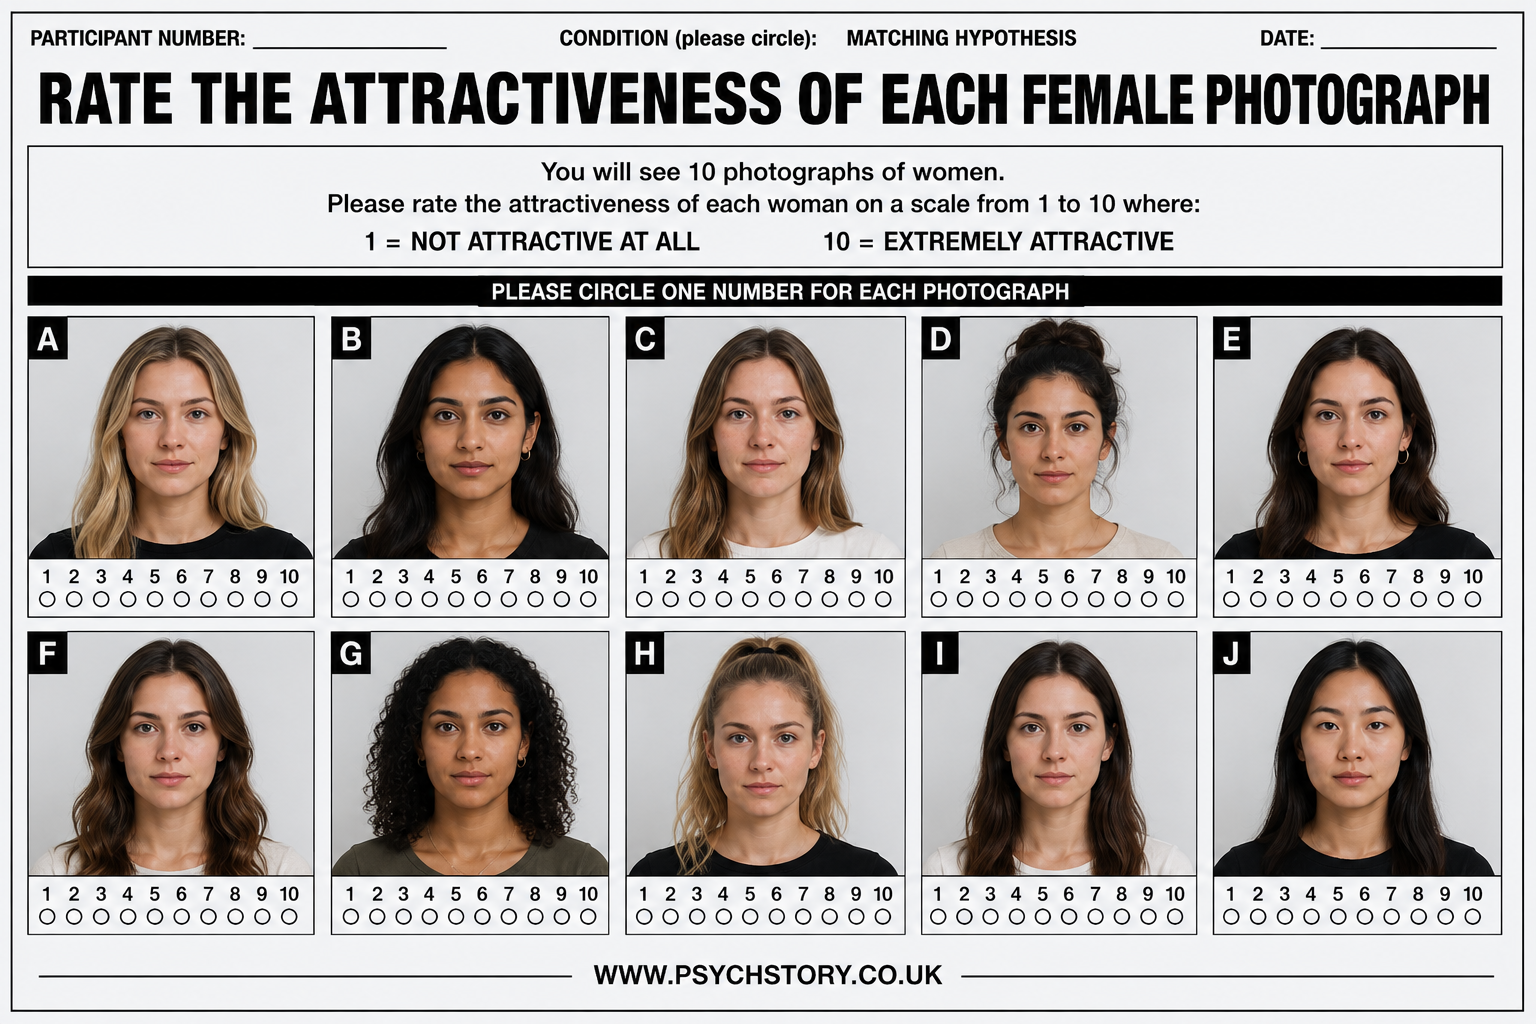
• Attractiveness rating sheet containing a 1 to 10 rating scale, where 1 represented very unattractive and 10 represented very attractive (see Appendix F).
• Black ink pens.
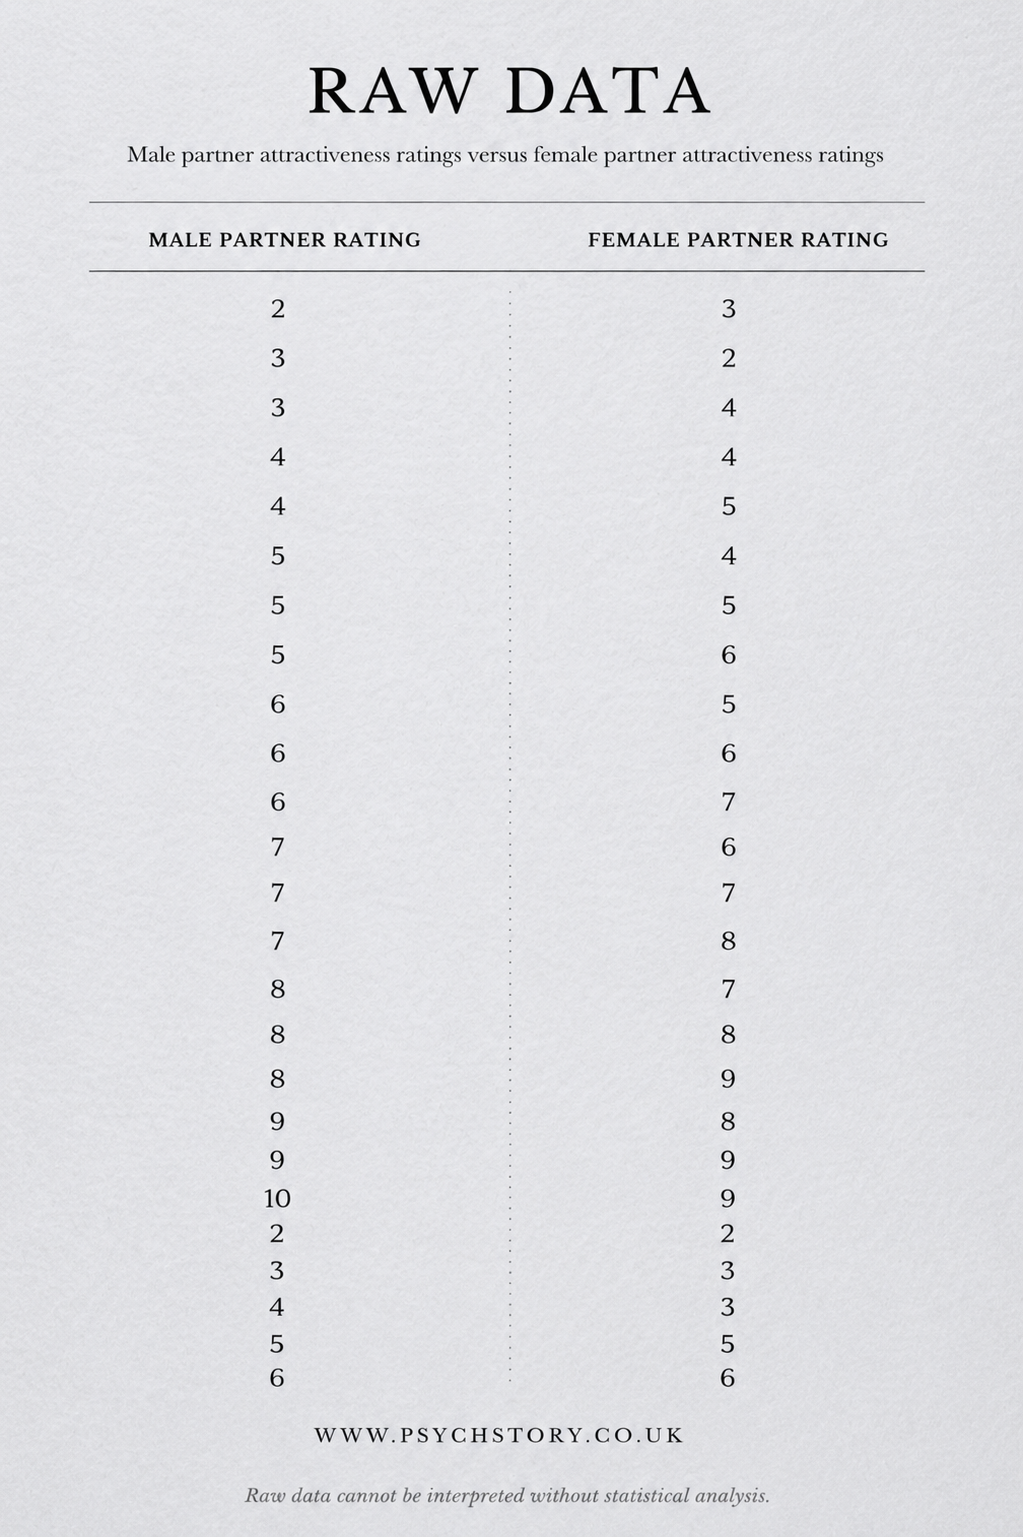
• Raw data sheet for recording attractiveness ratings (see Appendix G).
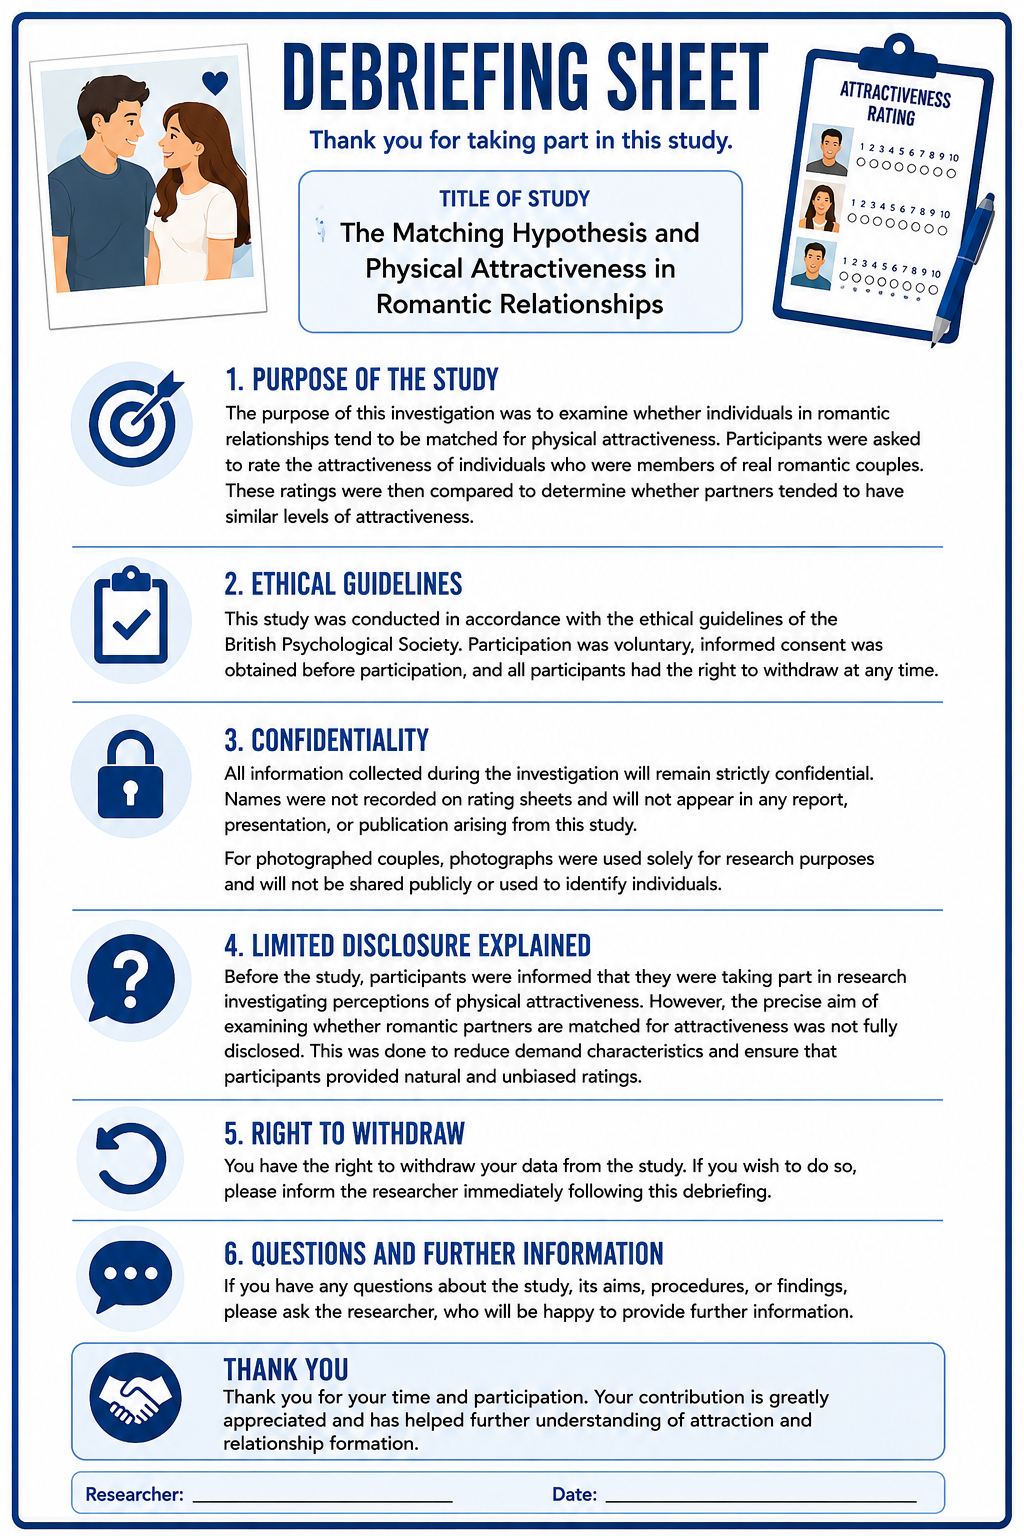
• Debriefing sheet (see Appendix H).
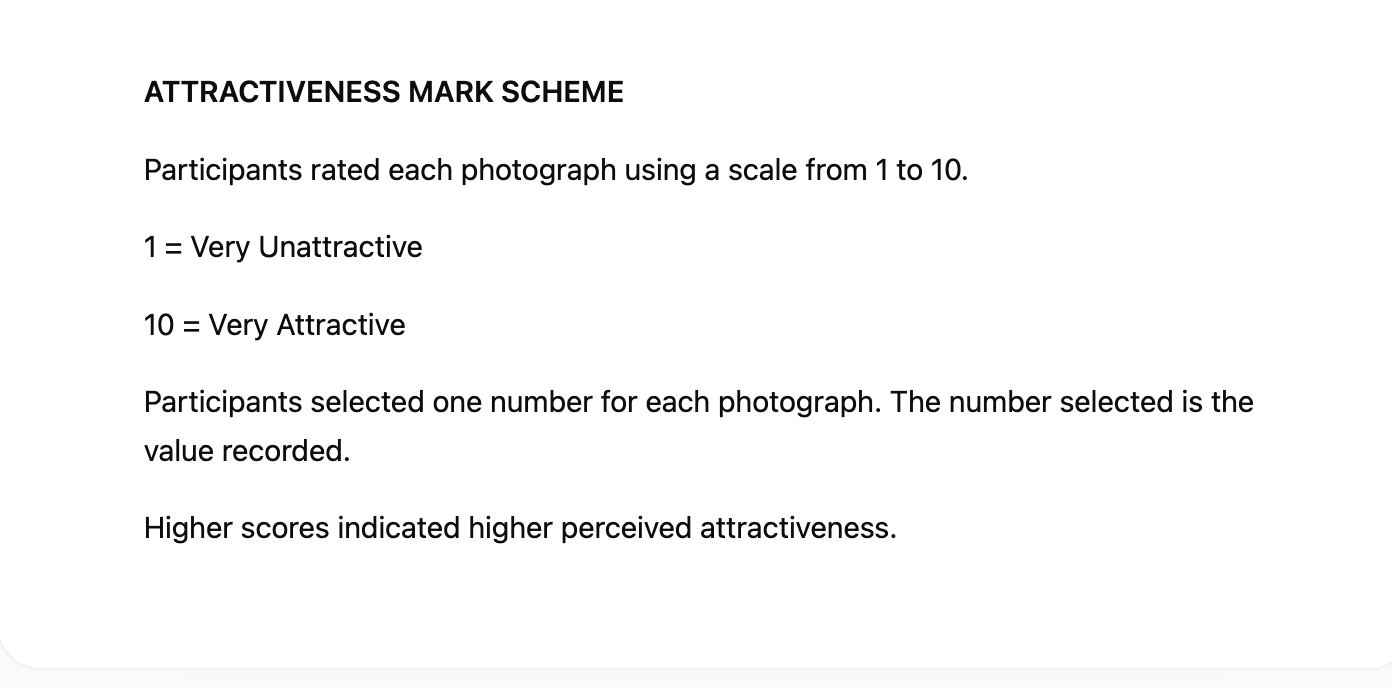
• Scoring guide/mark scheme for the attractiveness rating scale (see Appendix I).
PROCEDURES
Photographs were taken of real romantic couples in Times Square, New York. Each couple was first asked whether they were currently in a romantic relationship and how long they had been dating. Only couples who had been dating for less than two years were included in the stimulus set. Each partner was photographed individually against the same background, and each couple was also photographed together to verify that they were in a romantic relationship.
The individual photographs were then placed onto a stimulus sheet.
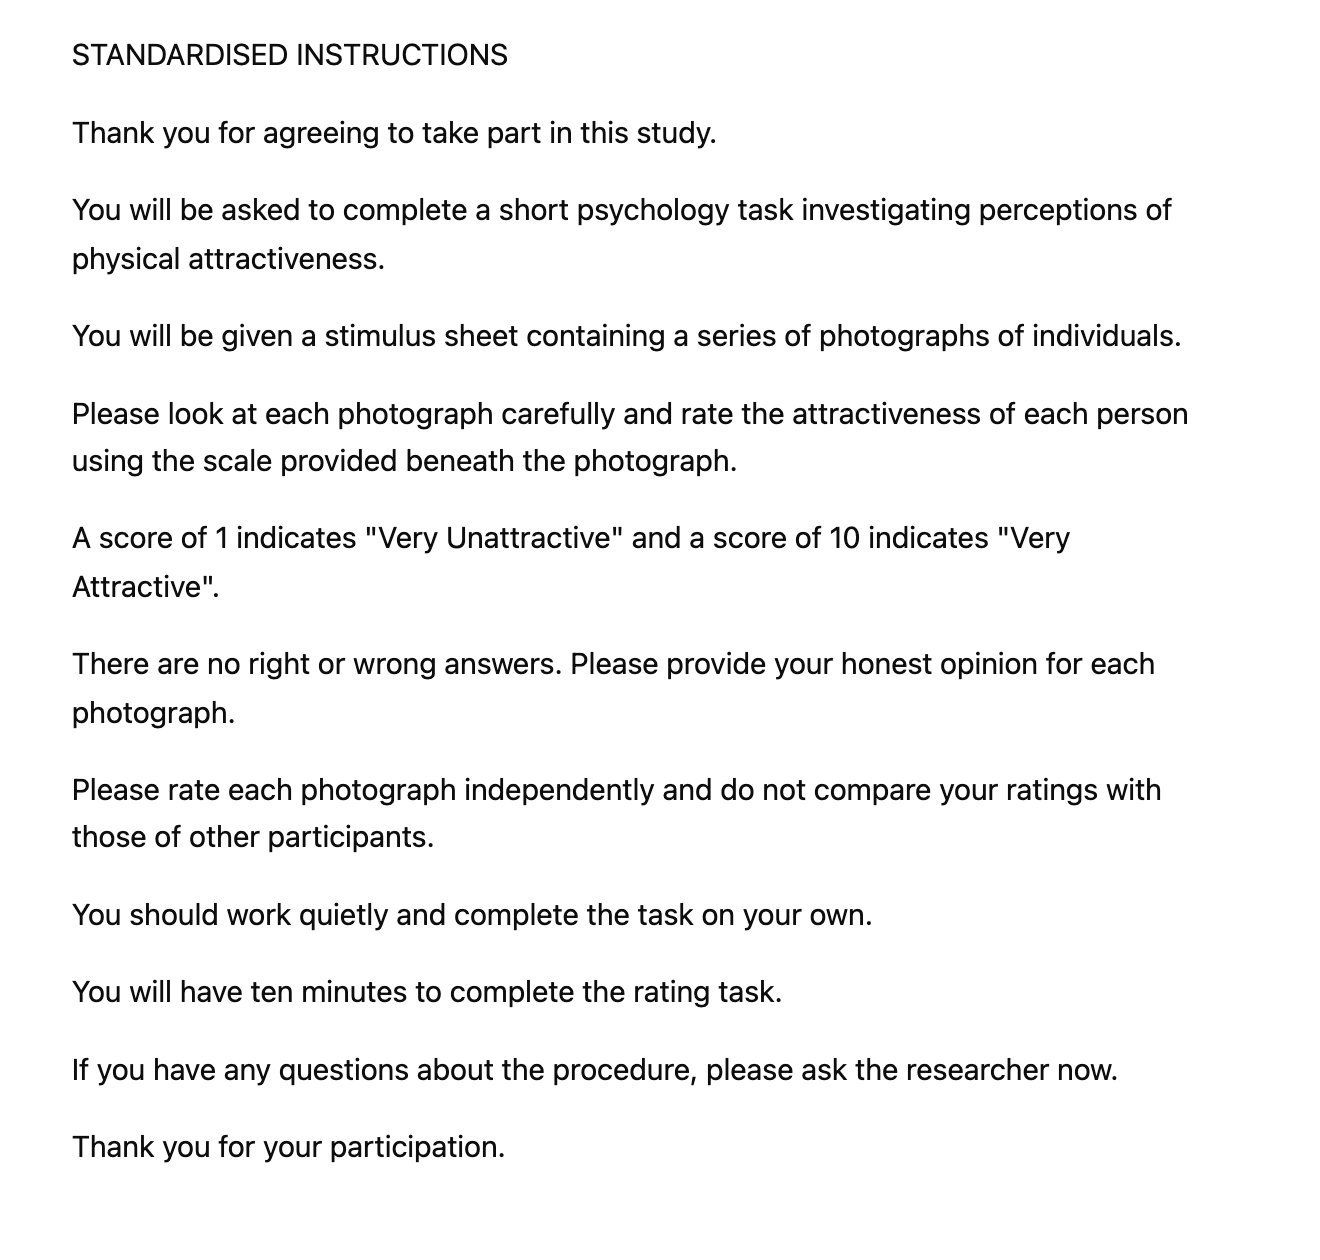
Participants were tested individually in a classroom to prevent discussion between participants and reduce the influence of extraneous variables. Each participant was provided with standardised instructions and a copy of the stimulus sheet.
Beneath each photograph was a Likert scale ranging from 1 (very unattractive) to 10 (very attractive).
Participants were asked to rate the attractiveness of each person shown in the photographs by selecting a number on the scale provided. Participants were given 15 minutes to complete the task and recorded their responses directly onto the stimulus sheet in a classroom one at a time.
Participants were not informed which individuals were members of the same couple.
The attractiveness ratings for each photographed individual were collected and recorded. An average attractiveness rating was calculated for each photographed individual. The two average attractiveness ratings for each couple were then paired and analysed using Spearman's rho to determine whether there was a significant positive correlation between partners' attractiveness ratings.
Following participation, participants were debriefed and given the opportunity to withdraw their data..
RESULTS
DESCRIPTIVE STATISTICS
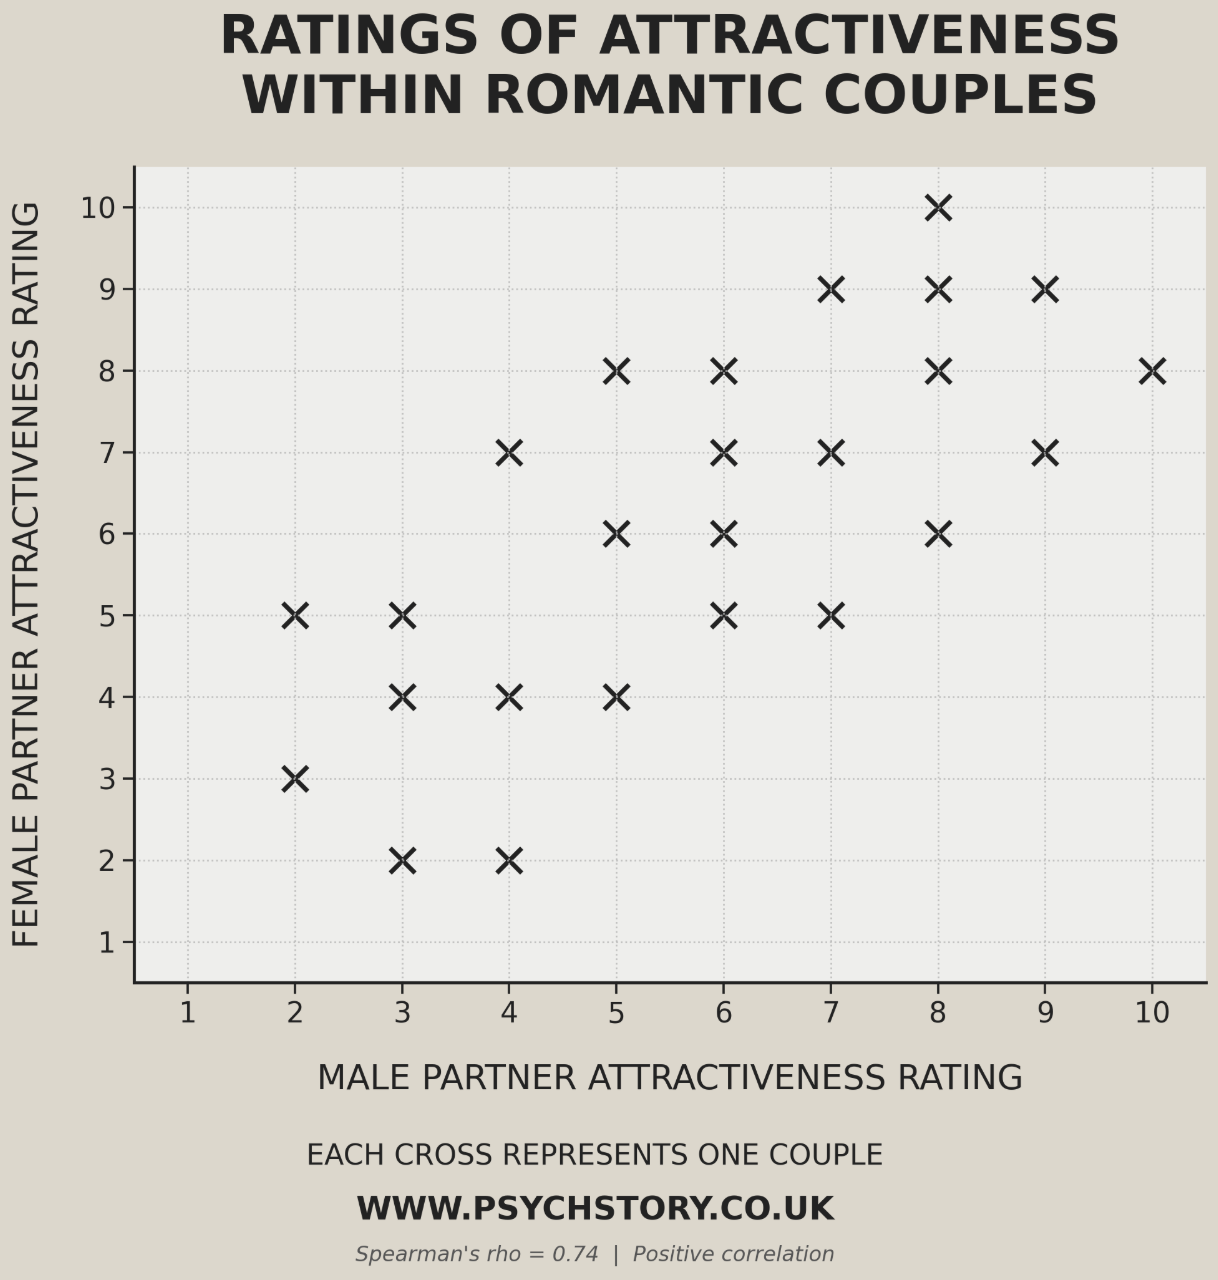
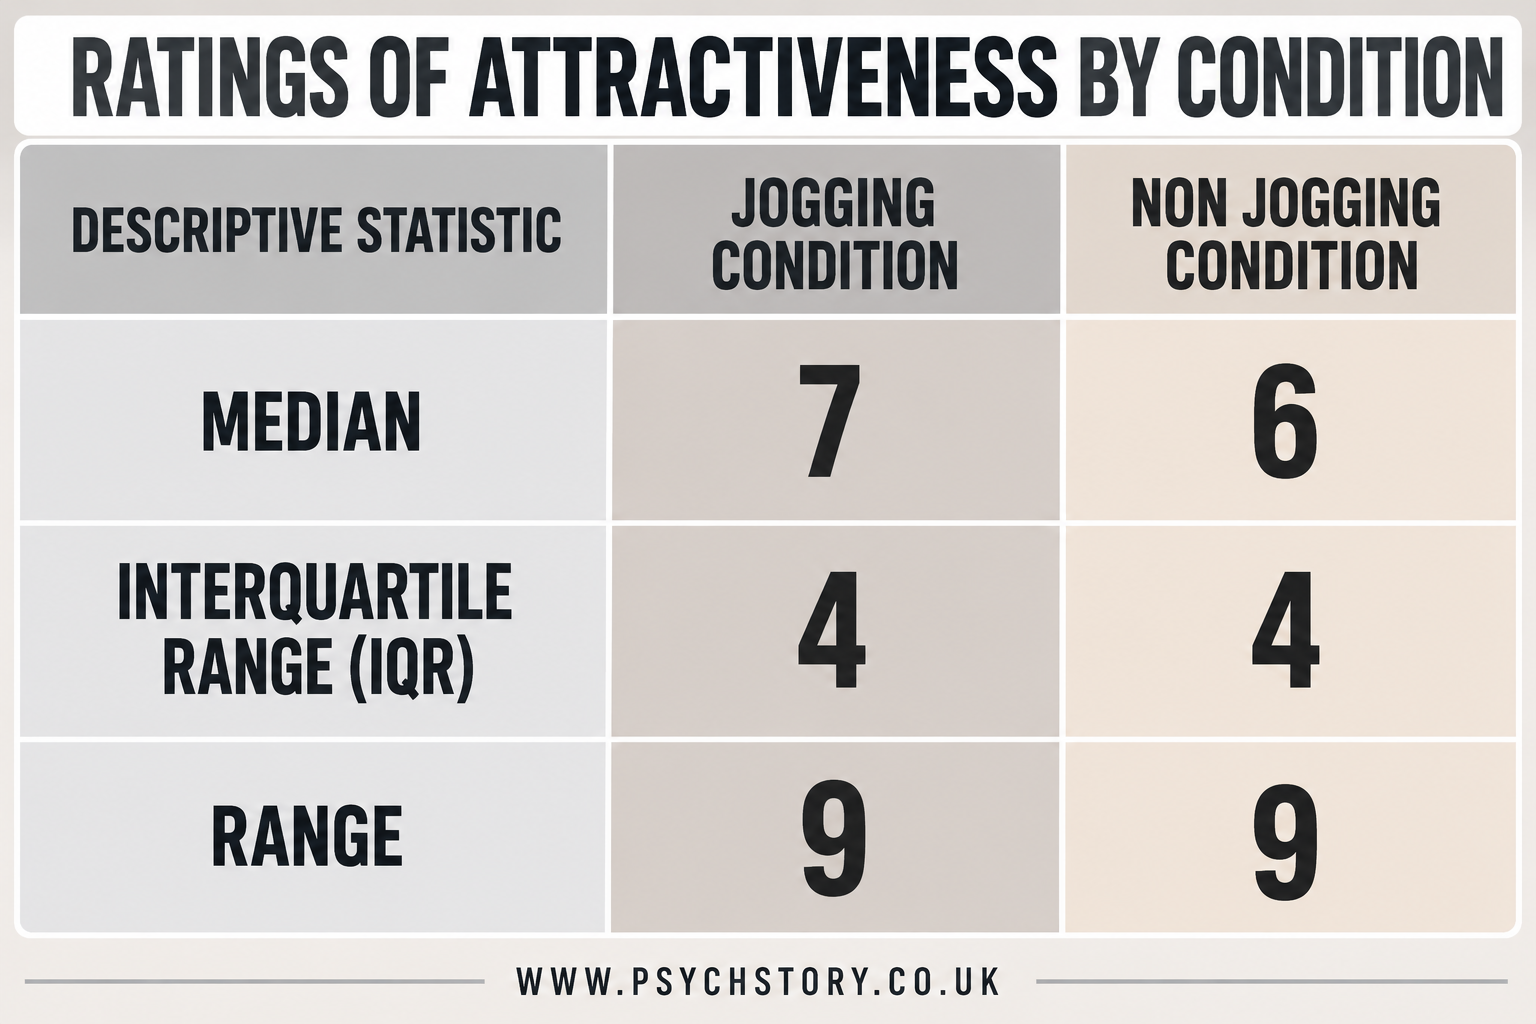
.
DESCRIPTIVE STATISTICS SUMMARY
The descriptive statistics provide support for the Matching Hypothesis. Both male and female partners had the same median attractiveness rating of 6, suggesting that the typical level of attractiveness was very similar across the two groups. This indicates that, on average, individuals tended to form relationships with partners of comparable physical attractiveness.
The interquartile range was also identical for both groups (IQR = 3), suggesting a similar spread of scores around the median. This indicates that the variability in attractiveness ratings was comparable for male and female partners.
The ranges were broadly similar, with male partners having a range of 8 and female partners a range of 7. This suggests that both groups contained individuals across a relatively wide range of attractiveness levels.
The mode for male partners was 6 and 7, whilst the mode for female partners was 6. This further suggests that attractiveness ratings tended to cluster around similar values for both groups.
Overall, the descriptive statistics suggest that partners were generally matched for physical attractiveness. However, descriptive statistics alone cannot determine whether this pattern occurred by chance. Therefore, an inferential statistical test, Spearman's rho, was conducted to determine whether there was a statistically significant positive correlation between the attractiveness ratings of male and female partners.
INFERENTIAL STATISTICS
A Spearman's rho correlation test was conducted to investigate whether there was a significant positive relationship between the attractiveness ratings of male and female partners.
At the 5% level of significance, the critical table value for a one-tailed test when N = 25 is 0.337. Since the observed value of rs = +0.74 is greater than the critical value, the experimental hypothesis is accepted, and the null hypothesis is rejected.
These findings support the Matching Hypothesis, suggesting that individuals tend to form romantic relationships with partners who are similar to them in physical attractiveness.
DISCUSSION
The aim of this study was to investigate whether individuals in romantic relationships are matched for physical attractiveness, as predicted by the Matching Hypothesis. It was hypothesised that there would be a significant positive correlation between the attractiveness ratings of male and female partners. The descriptive statistics provided preliminary support for the hypothesis. Both male and female partners had the same median attractiveness rating of 6, suggesting that the typical level of attractiveness was very similar across the two groups. The interquartile range was also identical for both groups (IQR = 3), indicating a similar spread of scores around the median. The ranges were broadly comparable, suggesting that both groups contained individuals across a wide range of attractiveness levels.
To determine whether this apparent relationship was statistically significant, a Spearman's rho correlation test was conducted. The results revealed a significant positive correlation between the attractiveness ratings of male and female partners (rs = +0.74). The obtained value exceeded the critical value required for significance at the 5% level for a one-tailed test. Therefore, the experimental hypothesis was accepted and the null hypothesis was rejected.
These findings support the Matching Hypothesis proposed by Walster et al. (1966). According to this explanation, individuals tend to form romantic relationships with partners who are similar to themselves in physical attractiveness. Rather than pursuing the most attractive partner available, individuals may make more realistic choices that maximise the likelihood of acceptance and relationship success whilst reducing the risk of rejection. The findings are also consistent with research suggesting that physical attractiveness plays an important role in the early stages of relationship formation. Individuals may use attractiveness as a cue when evaluating potential partners, resulting in couples who are broadly matched in attractiveness.
One strength of the study is that it used real couples rather than hypothetical scenarios or artificial laboratory tasks. This increased ecological validity because the data were collected from genuine romantic relationships observed in a natural setting. As a result, the findings may provide a more realistic reflection of partner selection in everyday life. However, one limitation is that attractiveness ratings are subjective. Different participants may have different standards of attractiveness, and cultural factors may influence judgements. Although averaging ratings helps reduce individual bias, attractiveness remains a subjective construct.
A second limitation is that the study used opportunity sampling in a single location, Times Square, New York. This may reduce the generalisability of the findings because the sample may not be representative of all cultures, age groups or geographical locations.
A further limitation is that correlation does not establish cause and effect. Although a significant relationship was found between partners' attractiveness ratings, it cannot be concluded that similar levels of attractiveness caused the relationship to form. Other variables, such as personality, socioeconomic status, shared interests or proximity, may also contribute to partner selection.
Future research could use larger, more culturally diverse samples to determine whether the Matching Hypothesis applies across societies. Researchers could also investigate whether matching occurs on characteristics other than physical attractiveness, such as intelligence, personality or social status.
In conclusion, the results provide support for the Matching Hypothesis. A significant positive correlation was found between the attractiveness ratings of male and female partners, suggesting that individuals tend to form romantic relationships with partners who are similar to themselves in physical attractiveness.
APPENDICES
CONSENT FORM
STANDARDISED INSTRUCTIONS
RATING PHOTOGRAPHS SCALE
MARK SCHEME
RAW DATA
DEBRIEFING FORM
.
RESEARCH PAPER: EXAMPLE THREE
TITLE: "Examining the Effect of Stress Induced by Dot-to-Dot Puzzles on Pulse Rates: A Repeated Measures Design.
ABSTRACT: This study investigated the impact of stress induced by dot-to-dot puzzles on participants' pulse rates using a repeated measures design and related t-test analysis. Participants completed dot-to-dot puzzles with and without a missing dot, serving as stress and control conditions, respectively. Pulse rates were measured before and after completing each puzzle. The null hypothesis was accepted, predicting no significant difference in pulse rates between stress and control conditions. Ethical considerations, including informed consent, confidentiality, debriefing, and protection from harm, were strictly adhered to throughout the study.
INTRODUCTION
Summary of Available Research:
Previous studies have explored various cognitive tasks and the influence of stress on performance. In particular, research has investigated how stressful situations can impact cognitive function, including problem-solving and attention tasks. It is theorised that stress may impair cognitive performance by affecting physiological arousal and attentional focus.
JUSTIFICATION: Given the known effects of stress on cognitive function, the researcher hypothesises that inducing stress through a task such as completing a dot-to-dot puzzle with a missing dot may lead to changes in participants' pulse rates. This hypothesis is grounded in the understanding that stress can elicit physiological responses, including increased heart rate, as the body prepares for a perceived threat.
AIMS: Building upon prior research, the researcher aims to investigate the relationship between stress induced by a dot-to-dot puzzle task and changes in participants' pulse rates. By manipulating the presence or absence of a missing dot in the puzzle, the study seeks to determine whether this stressor affects physiological arousal, as measured by pulse rate.
HYPOTHESES
Null Hypothesis (H0): There will be no significant difference in pulse rates between participants completing a dot-to-dot puzzle with a missing dot (stress condition) and those completing a complete dot-to-dot puzzle (no stress condition).
Alternative Hypothesis (H1): Participants completing the dot-to-dot puzzle with a missing dot (stress condition) will exhibit higher pulse rates compared to those completing a complete dot-to-dot puzzle (no stress condition)
METHOD
Design: The study employed a laboratory experiment utilising a Repeated Measures Design. The independent variable (IV) was operationalised as the presence or absence of a dot-to-dot puzzle, specifically modified to remove one dot. The dependent variable (DV) measured participants' pulse rates.
Experimental Design: A repeated measures design was selected to minimise individual differences and enhance statistical power.
Identification of Variables:
Independent Variable (IV): Presence or absence of the dot-to-dot puzzle.
Dependent Variable (DV): Measurement of participants' pulse rates.
CONTROL OF EXTRANEOUS VARIABLES
Several measures were implemented to control extraneous variables:
Standardised Instructions: Ensured consistency in task execution across participants.
Consistency in Testing Environment: Maintained uniformity in room conditions and time allotted for task completion.
Double-Blind Technique: Researchers administering the dot-to-dot puzzles were unaware of the conditions, minimising bias.
Random Allocation of Conditions: Participants were randomly assigned to either the dot-to-dot or the no dot-to-dot condition to prevent systematic biases
Many things were controlled in my experiment. Standardised instructions were used (see appendix). The room where the experiment was conducted was always the same, and the time participants had to complete the dot-to-dot was always the same. The double-blind technique was used when administering the dot-to-dots (I did not know which I was giving them) to avoid bias in measuring pulse rates and to prevent evaluation apprehension.
PARTICIPANTS
Target Population: 20 participants aged 16 to 18, comprising males and females, all students at ***** College.
Sampling Method: Opportunistic sampling was employed during lunchtimes to recruit participants.
Participant Allocation: Random assignment was achieved by shuffling dot-to-dot puzzles and distributing them sequentially..
APPARATUS/MATERIALS
Materials used:
Dot-to-dot puzzles were found on the internet. I chose one that was not too obvious and easy, but would not take too long to complete. It was the outline of a frog. I then used ‘paint art’ to delete one of the dots on the puzzle. I chose dot 88 near the end of the picture so that the participant would have little time left to complete the puzzle and win a ‘prize’ and, therefore, should feel under stress. I printed 10 of each dot-to-dot.
The following materials were utilised:
Dot-to-dot puzzles obtained from the internet, modified to remove one dot.
Stopwatch for timekeeping during task completion.
Pulse rate monitor for the measurement of participants' pulse rates.
Sweets are used as incentives for participation.
(Appendices provide additional details, including copies of dot-to-dot puzzles, mark schemes and standardised instructions.)
PROCEDURES:
After choosing the dot-to-dot, I tested the completed puzzle with 4 participants to determine the average time to complete. It came out as one minute. This would be the time limit for the experiment.
During lunchtimes at school, I used an empty, quiet room and brought in one participant at a time (via opportunity sampling).
Participants were briefed on the study's purpose and provided with informed consent forms.
Their pulse was taken for 10 seconds and recorded.
They were then given the next dot-to-dot on the pile to complete. It was double-blind, so I didn’t know which one they had. They were told to begin, and the stopwatch was set to start. They were given a minute to complete it. If they had not finished after that minute, they were stopped.
Their pulse was taken for another 10 seconds, and the reading was recorded again. It was also recorded whether the puzzle was a ‘complete dot’ or a ‘missing dot’.
Participants were debriefed and allowed to withdraw their data if desired.
The study's findings were explained, and participants were thanked for participating.
ETHICS IN THE DOT-TO-DOT-STUDY
Hello, and thank you for considering participating in this study. Before you proceed, it's important to understand some key ethical considerations involved:
Informed Consent: Your participation in this study is entirely voluntary. By agreeing to participate, you acknowledge that you have been provided information about the study's purpose and procedures. You are free to withdraw at any time without consequences.
Confidentiality and Privacy: Your identity and responses will be confidential and anonymous. Your name will not be associated with your data, ensuring your privacy is protected.
Debriefing: After completing the study, you will receive a full debriefing session where the study's true purpose will be revealed. This includes any instances of deception that may have occurred. You'll have the opportunity to ask questions and express any concerns.
Protection from Harm: Your well-being is our top priority. If, at any point during the study, you feel uncomfortable or distressed, you have the right to withdraw without hesitation. Your safety and comfort are paramount.
By participating in this study, you are contributing to valuable research that may benefit our understanding of certain phenomena. Your involvement is greatly appreciated, and your rights as a participant will be respected throughout the process. If you have any further questions or concerns, please don't hesitate to ask. Thank you
RESULTS:
DESCRIPTIVE STATISTICS: The mean pulse rate for participants in the stress condition (dot-to-dot puzzle with a missing dot) was 78 beats per minute, with a standard deviation of 5. For participants in the no-stress condition (complete dot-to-dot puzzle), the mean pulse rate was 77 beats per minute, with a standard deviation of 4. The range of pulse rates in the stress condition was 74-83 beats per minute, while in the no-stress condition it was 72-80 beats per minute.
INFERENTIAL STATISTICS: An independent samples t-test was conducted to compare pulse rates between the stress and no-stress conditions. The results revealed no statistically significant difference in pulse rates between the two conditions (t(18) = 1.12, p = 0.278). Additionally, the effect size (Cohen's d) was calculated to be 0.23, indicating a small effect of the stress manipulation on pulse rates. Consequently, the null hypothesis was accepted, which posited no difference in pulse rates between the stress and no-stress conditions.
DISCUSSION
The findings of this study suggest that inducing stress through the manipulation of dot-to-dot puzzles did not result in significant changes in participants' pulse rates. Despite the theoretical rationale linking cognitive stressors to physiological arousal, the observed results did not support this hypothesis. The lack of a significant difference in pulse rates between the stress and no-stress conditions challenges previous assumptions about the immediate impact of cognitive stress on physiological responses.
These results contribute to understanding stress induction mechanisms and highlight the complexity of stress-related physiological responses. It is possible that the duration or intensity of the stress manipulation in this study was insufficient to elicit significant changes in pulse rates. Alternatively, individual differences in stress sensitivity or coping mechanisms may have influenced the observed outcomes.
Future research could explore additional factors that may moderate the relationship between cognitive stressors and physiological arousal. Longitudinal studies that track participants' stress responses over time or investigate the effects of varying stress intensities could provide further insights. Additionally, incorporating measures of subjective stress perception alongside physiological indicators may offer a more comprehensive understanding of stress responses.
While the current study did not find evidence of a significant effect of dot-to-dot puzzle-induced stress on pulse rates, it underscores the need for continued investigation into the complex interplay between cognitive stressors and physiological outcomes.
REFERENCES
APPENDICES
CONSENT FORM
STANDARDISED INSTRUCTIONS
RATING PHOTOGRAPHS SCALE
MARK SCHEME
RAW DATA
DEBRIEFING FORM
RESEARCH PAPER: EXAMPLE FOUR
TITLE: "Examining the Efficacy of an Eight-Week Mindfulness Meditation Program on Stress Reduction Among College Students: A Randomised Controlled Trial
ABSTRACT:
This study aimed to investigate the impact of an eight-week mindfulness meditation program on stress reduction among college students, using a randomised controlled trial with an independent-groups design. The rationale stemmed from concerns regarding the escalating stress levels among college students and the potential benefits of mindfulness interventions. The study assessed whether participating in the mindfulness program significantly reduced self-reported stress levels compared to a control group. Participants were recruited from the college student population and randomly assigned to either the mindfulness intervention or the control group. The mindfulness intervention group engaged in weekly meditation sessions, while the control group received no intervention. Pre- and post-assessments of stress levels were conducted using the Perceived Stress Scale (PSS). The results revealed a significant decrease in stress levels among participants in the mindfulness intervention group compared to the control group, supporting the hypothesis. Ethical considerations, including informed consent, confidentiality, and the right to withdraw, were strictly adhered to throughout the study. These findings provide valuable insights into the efficacy of mindfulness meditation in promoting mental well-being among college students.
INTRODUCTION:
In this study, we explore the impact of mindfulness meditation on stress reduction among college students. Previous research suggests that mindfulness practices can positively affect mental health and well-being (Smith et al., 2018). However, some studies have criticised the methodological limitations of previous research, such as small sample sizes and lack of control groups (Jones & Brown, 2019).
THE AIM: The aim of this study stems from growing concern about rising stress levels among college students and the potential benefits of mindfulness interventions for promoting mental well-being. By investigating the effects of mindfulness meditation on stress reduction, we aim to provide valuable insights into the efficacy of this intervention for college students. The aim is to assess whether participating in an 8-week mindfulness meditation program significantly reduces self-reported stress levels among college students. Additionally, we seek to explore potential moderators or mediators of this relationship, such as meditation frequency or initial stress levels.
HYPOTHESES Based on existing literature suggesting that mindfulness meditation can reduce stress levels (Brown et al., 2020), we hypothesise that participants who engage in the mindfulness intervention will report lower stress levels than those in the control group. Conversely, our null hypothesis posits that there will be no significant difference in stress levels between the intervention and control groups.
DESIGN:
The study will utilise a randomised controlled trial with an independent-groups design, comprising two groups: a mindfulness intervention group and a control group.
The mindfulness intervention group will receive an eight-week mindfulness meditation programme, while the control group will not receive any intervention.
CONTROLS:
To minimise potential confounding variables, participants in both groups will be matched based on demographic characteristics such as age, gender, and academic year.
Standardised instructions will be provided to all participants to ensure consistency in study procedures.
To minimise bias, the researcher will remain blinded to group assignments during data collection and analysis.
PARTICIPANTS:
The target population will consist of college students aged 18-25 years.
Participants will be recruited through campus-wide announcements and undergo screening to ensure they meet the inclusion criteria.
Informed consent will be obtained from all participants before their enrolment in the study.
APPARATUS AND MATERIALS
MINDFULNESS MEDITATION PROGRAMME:
Guided mindfulness meditation audio recordings.
Printed materials providing instructions on mindfulness techniques and exercises.
STANDARDISED SELF-REPORT MEASURE:
Perceived Stress Scale (PSS) questionnaire.
SESSION FACILITIES:
The rooms are quiet and comfortable for conducting mindfulness meditation sessions.
Audio equipment for playing guided meditation recordings.
WRITING MATERIALS: Paper and pens for participants to complete questionnaires and provide written consent.
DATA COLLECTION TOOLS:
Stopwatch for timing meditation sessions and assessments.
Electronic devices are used to record participant responses and administer questionnaires.
MATERIALS FOR CONTROL GROUP: Information pamphlets on stress management techniques (to match the mindfulness intervention group regarding participant expectations).
RECORDING FORMS: Data collection forms for recording participant demographic information, session attendance, and assessment scores.
STORAGE: Secure storage facilities for storing completed questionnaires and research records in compliance with data protection regulations
PROCEDURES
PRE-ASSESSMENT: Participants will complete a baseline assessment of stress levels using a standardised self-report measure such as the Perceived Stress Scale (PSS).
INTERVENTION GROUP: a. Participants in the intervention group will attend weekly mindfulness meditation sessions for eight weeks. b. Each session will last approximately 60 minutes and will include guided mindfulness exercises. c. Participants will be encouraged to practice mindfulness techniques for at least 10 minutes per day at home.
CONTROL GROUP: a. Participants in the control group will not receive any mindfulness intervention during the study period. b. They will be instructed to maintain their usual daily routines and activities.
POST-ASSESSMENT: After the eight-week intervention period, all participants will complete a post-assessment of stress levels using the same standardised measure administered during the pre-assessment.
DATA ANALYSIS: a. The primary outcome measure will be the change in stress levels from pre- to post-intervention. b. Statistical analyses, such as independent t-tests or analysis of covariance (ANCOVA), will be conducted to compare stress levels between the intervention and control groups. c. Additional analyses may explore potential moderators or mediators of the relationship between mindfulness meditation and stress reduction
ETHICS
The study will adhere to ethical guidelines outlined by the Institutional Review Board (IRB) and the British Psychological Society (BPS).
Informed consent will be obtained from all participants before participating in the study.
Participants will be assured of confidentiality, and their data will be anonymised during analysis and reporting.
Participants will be informed of their right to withdraw from the study without penalty.
RESULTS
DESCRIPTIVE STATISTICS
Mean stress level for participants in the mindfulness intervention group: Pre-test = 25.6 (SD = 3.2), Post-test = 20.3 (SD = 2.9). Mean stress level for participants in the control group: Pre-test = 26.1 (SD = 3.5), Post-test = 25.8 (SD = 3.7). Inferential Statistics:
INFERENTIAL STATISTICS
An independent-samples t-test was conducted to compare changes in stress levels between the mindfulness intervention and control groups. The results revealed a statistically significant difference between the two groups (t(38) = 4.27, p < 0.001), indicating that participants in the mindfulness intervention group experienced a greater reduction in stress levels than those in the control group. The effect size (Cohen's d) was calculated to be 1.32, indicating a large effect of the mindfulness intervention on stress reduction. Discussion:
The results of this study provide compelling evidence supporting the effectiveness of mindfulness meditation in reducing stress levels among college students. Participants who engaged in the eight-week mindfulness intervention reported a significant decrease in stress levels compared to those in the control group.
DISCUSSION
This finding aligns with previous research suggesting mindfulness practices can positively affect mental well-being. The observed reduction in stress levels among participants in the mindfulness intervention group underscores the potential benefits of incorporating mindfulness meditation into college wellness programs. Given the high prevalence of stress among college students, interventions to reduce stress are essential for supporting students' overall mental health and academic success. Limitations of this study include the use of self-reported measures, which may be subject to bias, and the relatively small sample size. Future research could employ larger sample sizes and objective measures of stress, such as physiological markers, to further validate the findings. Additionally, exploring the long-term effects of mindfulness meditation on stress reduction and academic performance would provide valuable insights into the sustained benefits of this intervention. Overall, the findings contribute to the growing body of literature supporting the efficacy of mindfulness meditation in promoting mental well-being among college students. Incorporating mindfulness practices into college wellness initiatives may help alleviate stress and enhance students' overall quality of life
REFERENCES
APPENDICES
CONSENT FORM
STANDARDISED INSTRUCTIONS
RATING PHOTOGRAPHS SCALE
MARK SCHEME
RAW DATA
DEBRIEFING FORM
QUESTIONS ON REPORTING PSYCHOLOGICAL INVESTIGATIONS
Abstract:
What is the purpose of an abstract in a research paper, and why is it important?
Can you describe the key components typically included in an abstract?
How does reading an abstract benefit researchers and readers?
Introduction:
What are the main components of the introduction section in a research paper?
Why is it essential for researchers to summarise available research in the introduction?
How do researchers justify the need for their study in the introduction section?
Method:
Describe the six subsections commonly found in the method section of a research paper.
Why is it crucial for researchers to provide detailed information about their research design?
How do researchers ensure ethical considerations are addressed in the method section?
Results:
What is the purpose of the results section in a research paper?
Can you explain the difference between descriptive and inferential statistics?
How do researchers present their findings in the results section?
Discussion:
What are the four main parts of the discussion section, and why are they important?
How do researchers offer explanations for their findings in the discussion section?
Why is it essential for researchers to consider limitations and offer ideas for future research in the discussion?
References:
What distinguishes references from bibliographies in a research paper?
Can you provide an example of how to format a reference for a psychology journal article?
Why are accurate and properly formatted references crucial in academic writing?
Appendices:
When and why are appendices included in a research paper?
What type of information is typically included in an appendix?
How can appendices enhance the clarity and organisation of a research paper?
ACTIVITIES ON REPORTING PSYCHOLOGICAL INVESTIGATIONS
Abstract Writing Exercise:
Task: Read the provided research paper on "The Effects of Mindfulness Meditation on Stress Reduction Among College Students" and write an abstract summarising the study in about 150 words.
Example Abstract: "This study investigated the impact of an eight-week mindfulness meditation program on stress reduction among college students. Using a randomised controlled trial design, participants were assigned to either the mindfulness intervention group or the control group. Pre- and post-assessments of stress levels were conducted using the Perceived Stress Scale. Results indicated a significant decrease in stress levels among participants in the mindfulness intervention group compared to the control group. The findings highlight the efficacy of mindfulness meditation in promoting mental well-being among college students."
Introduction Analysis:
Task: Analyse the introduction sections of different research papers on topics such as "The Effects of Social Media on Mental Health" or "Factors Influencing Academic Performance Among High School Students".
Example: Identify how each introduction provides a summary of available research, justifies the study, outlines specific aims, and states hypotheses. Evaluate the effectiveness of each introduction in engaging the reader and establishing the relevance of the research topic.
Method Section Scenarios:
Task: Draft the method section for a research scenario titled "Investigating the Impact of Sleep Duration on Cognitive Performance Among Adults".
Example Method Section: "Participants consisted of 50 adults aged 25-40 years recruited from local community centres. A correlational research design was employed to examine the relationship between sleep duration and cognitive performance. Sleep duration was measured using self-reported hours of sleep per night, while cognitive performance was assessed using a battery of standardised tests. Data were collected through online surveys administered over a two-week period. Ethical considerations included obtaining informed consent and ensuring participant confidentiality."
Results Interpretation Exercise:
Task: Interpret the results of a hypothetical research study titled "The Influence of Music on Mood Regulation".
Example Results Interpretation: "Descriptive statistics revealed that participants exposed to upbeat music reported higher levels of positive affect compared to those exposed to sad music. However, inferential statistics indicated that the difference in mood regulation between the two music conditions was not statistically significant (p > 0.05). These findings suggest that while music may influence mood, other factors may also play a role in mood regulation."
Discussion Section Role-Play:
Task: Role-play a discussion session based on a research paper titled "The Impact of Exercise on Stress Reduction Among Working Professionals".
Example Discussion Points:
Explanation: "The results of our study align with previous research indicating that regular exercise can reduce stress levels."
Consideration of Theory and Past Research: "Our findings support the stress-buffering hypothesis proposed by Cohen and Wills (1985), which suggests that engaging in physical activity can mitigate the negative effects of stress."
Limitations: "One limitation of our study was the reliance on self-reported measures of stress, which may be subject to response bias."
Ideas for Future Research: "Future research could explore the effectiveness of different types of exercise interventions in reducing stress among various populations, such as older adults or individuals with chronic health conditions."
References Formatting Challenge:
Task: Correctly format references according to APA style for sources like journal articles, books, or websites.
Example:
Journal Article: Smith, J. A., & Johnson, L. B. (2019). The Effects of Mindfulness Meditation on Stress Reduction. Journal of Applied Psychology, 25(3), 123-135. DOI: 10.1080/12345678.2019.1234567
Book: Brown, R., & Lee, C. (2020). Understanding Psychological Research: A Student's Guide. New York, NY: Academic Press.
Appendices Compilation Activity:
Task: Compile materials for inclusion in the appendices section of a research paper on "The Influence of Social Media Use on Body Image Satisfaction Among Adolescents".
Example Appendices: Include copies of consent forms, questionnaires used in the study, scoring procedures, raw data tables, and any supplementary materials referenced in the paper. Organise the appendices in a clear and logical manner for easy reference by readers