
RESEARCH METHODS ASSESSMENT
RESEARCH METHODS ASSESSMENT
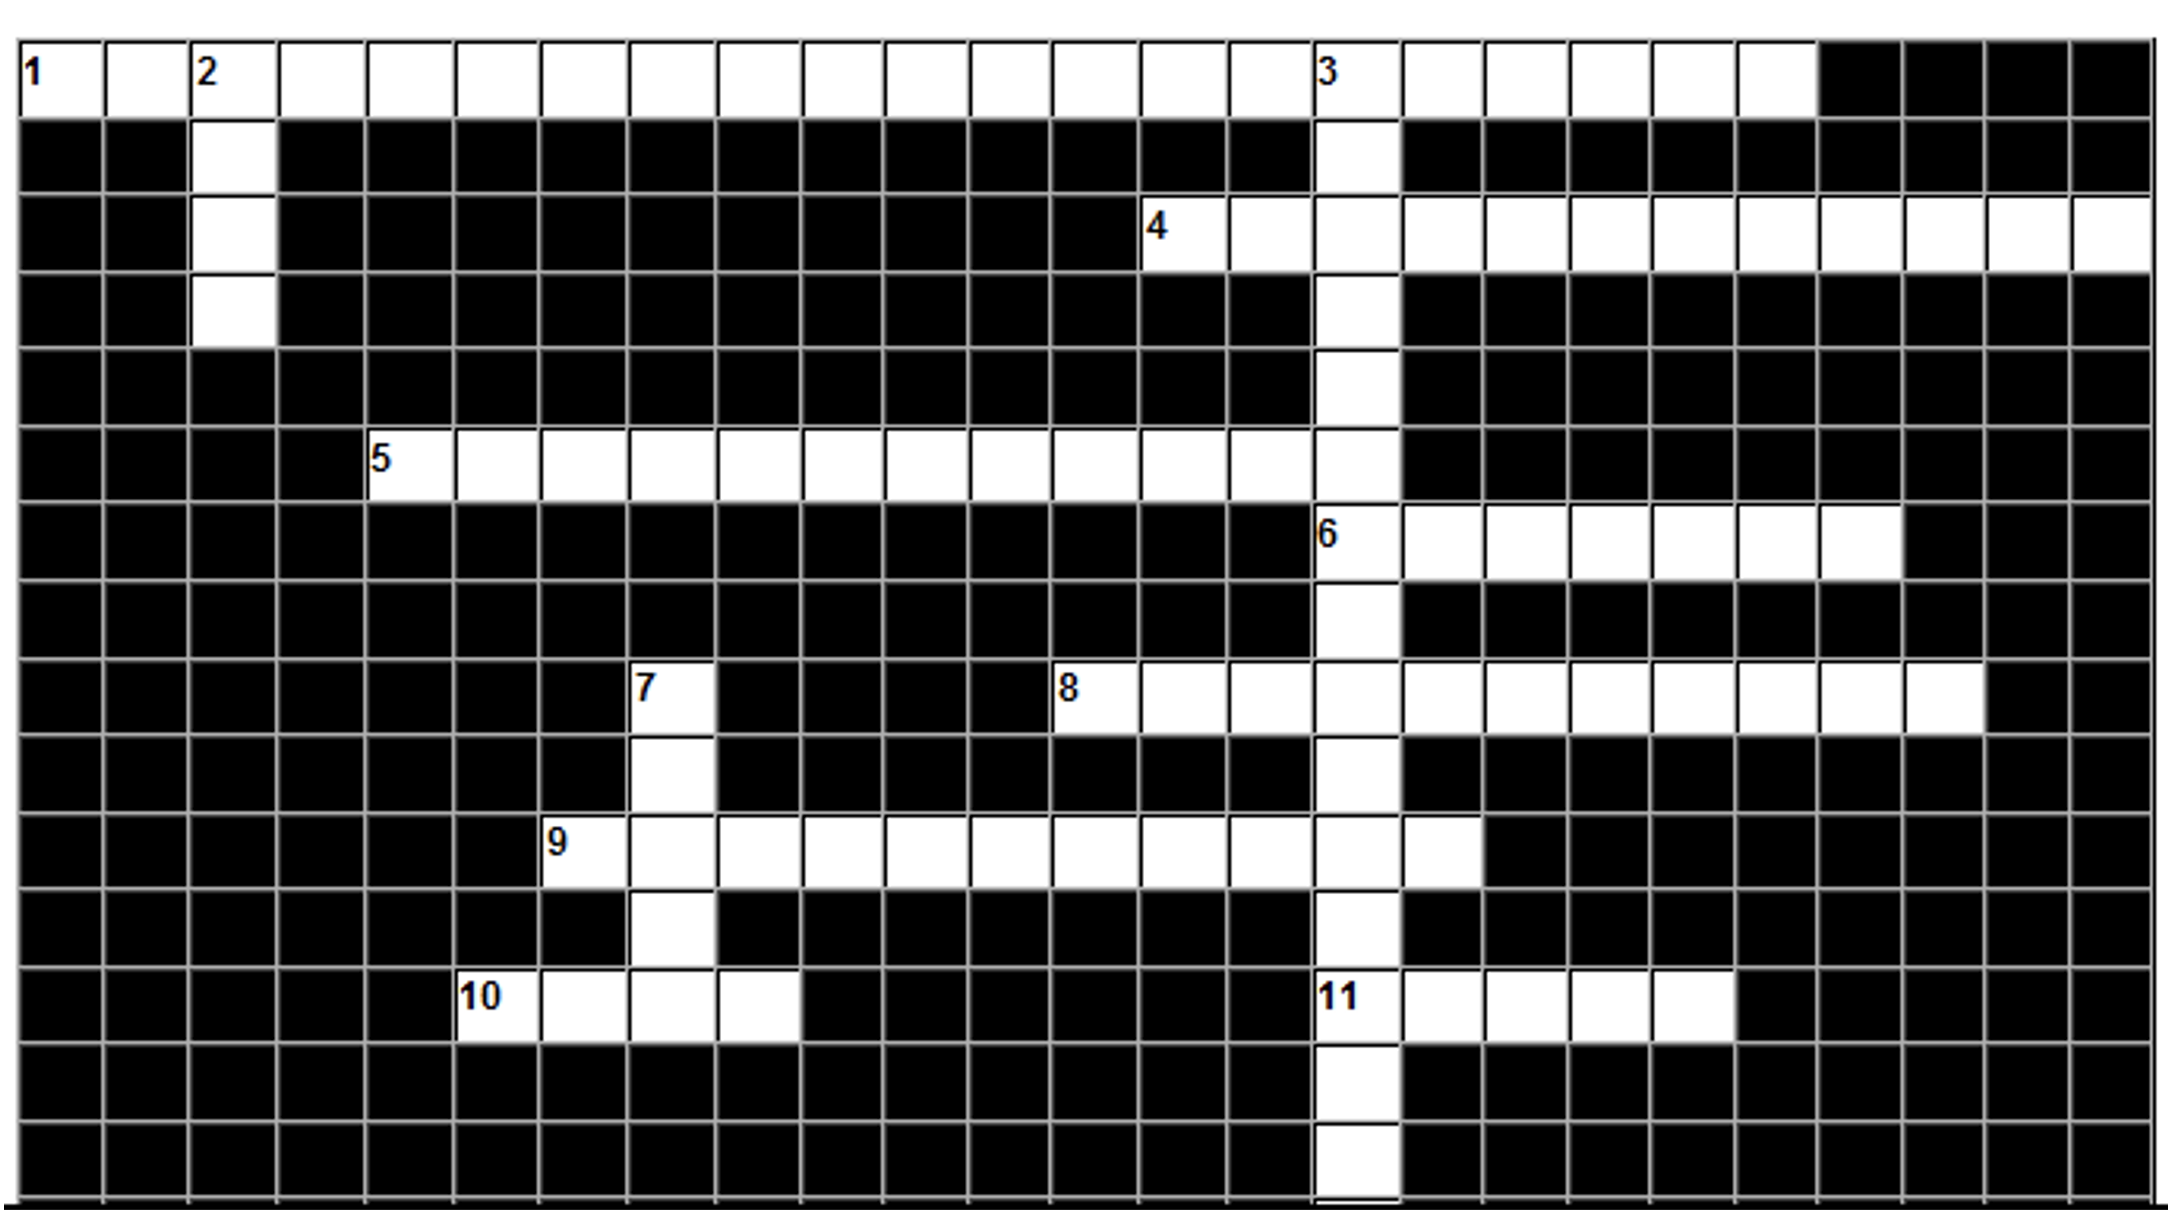
Across:
1. Features of an experiment which subconsciously influence the participants' performance
4. If the participants perform all the conditions, they might be fatigued or bored
5. Type of data expressed in numbers
6. Experiment which takes place in the participants' environment. The experimenter does not manipulate the IV
8. Hypothesis which predicts the direction in which the DV will change when the IV is manipulated
9. The extent to which measures are consistent
10. A measure of central tendency. The most frequently occurring score in a set of data
11. A measure of dispersion that measures the difference between the highest and the lowest score
12. Expressing the IV and the DV in a way that can be measured
Down:
2. A measure of central tendency. Can be distorted by extreme scores
3. An experimental design in which the participants do only one of the experimental conditions
7. A type of experiment which takes place in the participants' natural environment. The experimenter manipulates the IV.
SECTION A: THE EXPERIMENTAL METHOD
Identify and briefly outline the five key features of a true experiment. (5 marks)
For each of the following examples, identify which experimental method is being used.
A researcher sought to determine the effects of caffeine on memory. The researcher had two participant groups. One group drank strong coffee and was then given a list of words to recall. The second group was given a warm, caffeine-free drink and a list of words to recall.
Researchers examined aggression in primary-aged children. They produced a sheet of behavioural categories, including typical aggressive behaviours, and studied children in a primary school playground. The children were unaware that they were being observed.
Researchers examined attachment styles and created a scenario in a room. The children were brought into the room with their parents, and then the parents left them alone with a stranger. The researchers watched this behaviour from a two-way mirror.
A researcher wanted to see if people would help someone on the tube. They set up a situation where a confederate would collapse during a tube journey. The confederate appeared drunk in one condition and sick in the other condition. The researchers observed the behaviours of the passengers witnessing the event.
Explain why quasi-experiments are not classed as true experiments. (4 marks)
Explain why natural experiments are not classed as true experiments. (4 marks)
For each experiment type, outline two strengths and two limitations. (16 marks total)
• Laboratory
• Field
• Natural
• QuasiFor each experimental design below, outline two strengths and two limitations. (12 marks total)
Independent groups design/Between-subjects designRepeated measures design/Within-subjects design
Matched Pairs/Matched subjects design
ANSWERS SECTION A: THE EXPERIMENTAL METHOD
1. Five features of a true experiment. (5 marks)
Manipulation of the IV
Measurement of the DV
Random allocation to conditions
Control of extraneous variables and Standardised procedure
Have more than one condition, e.g., have an IV and a control or two or more IVs.
All of the above increase the ability to establish cause and effect.
2. For each of the following examples, identify which experimental method is being used.
A researcher sought to determine the effects of caffeine on memory. The researcher had two participant groups. One group drank strong coffee and was then given a list of words to recall. The second group was given a warm, caffeine-free drink and a list of words to recall. LABORATORY
Researchers examined aggression in primary-aged children. They produced a sheet of behavioural categories, including typical aggressive behaviours, and studied children in a primary school playground. The children were unaware that they were being observed. FIELD
Researchers examined attachment styles and created a scenario in a room. The children were brought into the room with their parents, and then the parents left them alone with a stranger. The researchers watched this behaviour from a two-way mirror. CONTROLLED OBSERVATION
A researcher wanted to see if people would help someone on the tube. They set up a situation where a confederate would collapse during a tube journey. The confederate appeared drunk in one condition and sick in the other condition. The researchers observed the behaviours of the passengers witnessing the event. FIELD
3. Why quasi-experiments are not true experiments. (4 marks)
No random allocation of participants to conditions; for example, in Brady's executive monkey study, the smaller monkey could not control the electric shocks it received.
In some quasi-experiments, the participants are the IV, not the conditions.
This means participant variables cannot be controlled, and cause and effect are harder to establish because there is no control over participant variables
4. Why natural experiments are not true experiments. (4 marks)
The IV is not manipulated by the researcher; it occurs naturally in real-world settings.
Limited control of variables because the researcher cannot control extraneous variables if they are manipulated.
Because the IV is not manipulated, researchers cannot randomly allocate participants to conditions. This is why natural and quasi-experiments are often confused
Causal conclusions are therefore weaker than true experiments.
5. For each experiment type, outline two strengths and two limitations. (16 marks total)
LABORATORY EXPERIMENTS
STRENGTHS
High control of extraneous variables
Easy to replicate because of abilioty to control extraneous variables.
LIMITATIONS
More likely to lack mundane realism.
More likely to lack ecological validity.
More likely to have Demand characteristics because participants know they are in an experiment.
More likely to have Experimenter bias
More likely to have social desirability bias
More likely to havethe Hawthorne effect
More likely to have Investigator effects
FIELD EXPERIMENTS
STRENGTHS
Less likely to lack mundane realism.
Less likely to lack ecological validity.
Less likely to have Demand characteristics because participants know they are in an experiment.
Less likely to have Experimenter bias
Less likely to have social desirability bias
Less likely to havethe Hawthorne effect
Less likely to have Investigator effects
LIMITATIONS
Less control of extraneous variables
Less likely to be able to replicate because of the inability to control extraneous variables.
More likely to have ethical issues are particpants cannot consent
NATURAL EXPERIMENTS
STRENGTHS
– High ecological validity because the independent variable occurs in a real-world setting
– Allow investigation of variables that would be unethical or impractical to manipulate experimentally
– Useful for studying large-scale or rare events
– Often involve naturally occurring groups, increasing realism
LIMITATIONS
– Lack of control over the independent variable reduces internal validity
– Confounding variables are difficult to control, making cause and effect hard to establish
– Random allocation is rarely possible
– Replication is often difficult or impossible
QUASI EXPERIMENTS
STRENGTHS
– Allow comparison between pre-existing groups where random allocation is not possible
– Greater control over procedures than natural experiments
– Can be conducted in lab or field settings
– Useful for studying individual differences such as gender, age, or clinical status because it can examine the differences between two or more distinct groups of participants. such as gender or age
LIMITATIONS
– Pre-existing differences between groups may confound results
– Cause and effect cannot be established with certainty
– Lower internal validity than true experiments
– Random allocation is not possible, limiting control
6. Experimental designs: strengths and limitations. (12 marks)
INDEPENDENT GROUPS/BETWEEN SUBJECTS DESIGN
STRENGTHS
– No order effects
– Lower risk of demand characteristics
– Suitable when exposure to more than one condition would affect behaviour
No order effects.
Fewer demand characteristics
Individual differences
More participants needed.
LIMITATIONS
– Participant variables may differ between groups
– Requires more participants
– Lower internal validity due to individual differences
REPEATED MEASURE/WITHIN SUBJECTS DESIGN
STRENGTHS
– Participant variables are controlled because the same participants take part in all conditions
– Fewer participants are needed
– Increased statistical power due to reduced individual differences
LIMITATIONS
– Order effects such as practice, fatigue, or boredom
– Increased risk of demand characteristics
– Participants may become aware of the aim of the study
MATCHED PAIRS/MATCHED SUBJECT DESIGN
STRENGTHS
– Participant variables are controlled by matching key characteristics
– No order effects
– Greater internal validity than independent groups
–Increased statistical power due to reduced individual differences
LIMITATIONS
– Time-consuming and difficult to match participants accurately
– Matching can never be exact
– Requires more participants than repeated measures
SECTION B: VARIABLES, AIMS, AND HYPOTHESES
Define
Define an independent variable (IV). (2 marks)
Define a dependent variable (DV). (2 marks)
3. For EACH of the following scenarios, identify the IV and the DV.
(1 mark for correct IV, 1 mark for correct DV. 20 marks total)a)
A psychologist wanted to test whether eating cheese before bed affects the number of nightmares experienced.
b) A researcher investigated whether hours of revision per week affect exam performance.
c) A psychologist tested whether caffeine intake affects reaction time.
d) A researcher examined whether the amount of sleep affects concentration levels.
e) A psychologist studied whether violent video game exposure affects aggression scores.
f) A researcher tested whether exercise frequency affects stress levels.
g) A psychologist investigated whether teacher praise affects classroom behaviour.
h) A researcher examined whether social media use affects self-esteem.
i) A psychologist tested whether the revision method affects test anxiety.
j) A researcher investigated whether background music affects memory recall.
4. Explain the difference between a directional and a non-directional hypothesis. (2 marks)
5. Define a null hypothesis. (2 marks)
6. Define an aim in psychological research. (2 marks)
7. Define a pilot study. (2 marks)
8. Explain what is meant by controlling extraneous and confounding variables. (2 marks)
9. To operationalise a variable means to define it precisely so that it can be measured objectively and is not vague or subjective.
Psychologists often find it difficult to operationalise internal mental states such as anxiety, stress, attraction, or intelligence because these cannot be directly observed or measured. Even brain scans do not provide a clear, direct measure of many psychological states. As a result, psychologists use standardised tests, questionnaires, or indirect measures.
For example, stress may be operationalised using heart rate or cortisol levels. However, this creates a problem because an increased heart rate could also indicate fear, excitement, or sexual attraction, not stress alone. This is why psychologists must carefully justify how their variables are operationalised and recognise the limitations of their measures
a. Risk-taking behaviour
b. Depression
c. Sexual attraction
d. Aggression
e. Short-term memory (STM)
f. Intelligence
g. Attachment to primary caregiver
h. Boredom
i. Empathy
j. Stress
k. Eating disorder:
10. For each scenario below, operationalise the variables clearly.
A) Adults with a mental illness will have impaired memory abilities.
B) Consumption of sugar-filled drinks will increase aggression in boys
C) Girls who use social networking sites are at risk of learning difficulties.
D) Stressed males will take more days off work.
E) Boys who watch professional football will be better footballers.
Writing Hypotheses
For each scenario, write:
A) a directional (one-tailed) hypothesis
B) a non-directional (two-tailed) hypothesis
C) a null hypothesis
11. Aggressive lyrics and aggression
Participants listen to music with either aggressive or non-aggressive lyrics. Their aggression is then measured using an aggression questionnaire.
A)
B)
C)
12. Ovulation and facial preference
Female participants, whether ovulating or not, rate masculine and feminine male faces.
A)
B)
C)
13. Television and creativity
Investigate the effect of television viewing on creativity.
You must operationalise the dependent variable.
A)
B)
C)
14. Finger ratios and testosterone
Investigate the relationship between 2D:4D finger length ratio and testosterone, operationalised as risk taking behaviour.
You must operationalise all variables further.
A)
B)
C)
15. Gender and conformity
Investigate whether males or females are more conforming.
You must operationalise all variables.
A)
B)
C)
16. Gender and risk-taking behaviour
Investigate gender differences in children's road play.
You must operationalise all variables.
A)
B)
C)
17. Sibling position and empathy
Investigate differences in empathy between older siblings and younger siblings.
You must operationalise all variables.
A)
B)
C)
18. Physiological arousal and attraction
Investigate the effect of physiological arousal on attraction to the opposite sex.
You must operationalise both the IV and the DV.
A)
B)
C)
ANSWERS: SECTION B: VARIABLES, AIMS, AND HYPOTHESES
1.Define an independent variable (IV) (2 marks)
· The independent variable (IV) is the variable that is manipulated by the researcher.
2.Define a dependent variable (DV). (2 marks)
The dependent variable (DV) is the variable that is measured and is affected by the IV. In other words, it is how the result is measured. (2 marks each)
3. For EACH of the following scenarios, identify the IV and the DV. (1 mark for correct IV, 1 mark for correct DV) (20 marks total)
a) A psychologist wanted to test whether eating cheese before bed affects the number of nightmares experienced.
IV: Eating cheese before bed
DV: Number of nightmares
b) A researcher investigated whether hours of revision per week affect exam performance.
IV: Hours of revision per week
DV: Exam performance
c) A psychologist tested whether caffeine intake affects reaction time.
IV: Caffeine intake
DV: Reaction time
d) A researcher examined whether the amount of sleep affects concentration levels.
IV: Amount of sleep
DV: Concentration levels
e) A psychologist studied whether violent video game exposure affects aggression scores.
IV: Violent video game exposure
DV: Aggression scores
f) A researcher tested whether exercise frequency affects stress levels.
IV: Exercise frequency
DV: Stress levels
g) A psychologist investigated whether teacher praise affects classroom behaviour.
IV: Teacher praise
DV: Classroom behaviour
h) A researcher examined whether social media use affects self-esteem.
IV: Social media use
DV: Self-esteem
i) A psychologist tested whether the revision method affects test anxiety.
IV: Revision method
DV: Test anxiety
j) A researcher investigated whether background music affects memory recall.
IV: Background music
DV: Memory recall
4. Difference between directional and non-directional hypotheses. (2 marks)
A directional hypothesis predicts the direction of the effect or relationship.
A non-directional hypothesis predicts a difference or relationship but not its direction.
5. Define a null hypothesis. (2 marks)
A null hypothesis states that there is no difference or relationship between variables, and that any observed effect is due to chance.
6. Define an aim. (2 marks)
An aim is a general statement of what the researcher intends to investigate.
7. Define a pilot study. (2 marks)
A pilot study is a small-scale trial run conducted before the main study to test procedures, materials, and design.
8. Controlling extraneous and confounding variables. (2 marks)
Extraneous variables are variables other than the IV that may affect the DV.
Confounding variables systematically vary with the IV and thereby threaten the validity of causal inference.
9. Operationalising variables
Risk-taking questionnaire, and methods that measure testosterone, e.g., finger length ratio, saliva
Depression: Depression scale, such as the global assessment of functioning (GAD scale),
Sexual attraction: ratings of opposite/same sex from photographs, pupil dilation
Aggression: observations in playgrounds, aggression scales,
Short-term memory (STM), test and digit span test
Intelligence, average of GCSEs, ALIS TEST, average of A-level results, IQ
Attachment to primary caregiver: strange situation (SS), Hazan and Shaver Love Quiz
Boredom: Brain wave measurement, boredom questionnaire, count yawns,
Empathy: Pupil dilation, Empathy scale, Experiment testing how many people stop
and help an abandoned child, brain scan
Stress/anxiety: SRRS, daily Hassles Scale, Blood pressure, heart rate, Galvanic skin test, standardised anxiety test
Eating disorder: standardised test about eating behaviour, e.g, The eating attitude test (EAT) or about body dysmorphia ( the body shape questionnaire (BSQ), weight, and whether Amenorrhoea (the absence or cessation of menstrual period) has occurred.
10. Operationalising variables in scenarios
A) Adults with a mental illness will have impaired memory abilities
Mental illness: diagnosis recorded in medical notes
Memory ability: score on a standardised memory test
B) Consumption of sugar-filled drinks will increase aggression in boys
Sugar consumption: number of sugar-filled drinks consumed in a fixed time period
Aggression: score on an aggression questionnaire
C) Girls who use social networking sites are at risk of learning difficulties
Social networking use: hours spent on social networking sites per day
Learning difficulties: score on a standardised academic performance test
D) Stressed males will take more days off work
Stress: score on a perceived stress questionnaire
Days off work: number of workdays absent over a set period
E) Boys who watch professional football will be better footballers
Watching football: hours spent watching professional football per week
Football ability: score on a standardised football skills assessment
Writing hypotheses
For each scenario:
A) Directional (one-tailed)
B) Non-directional (two-tailed)
C) Null
11. Aggressive lyrics and aggression
A) Participants who listen to music with aggressive lyrics will score higher on an aggression questionnaire than participants who listen to music with non-aggressive lyrics.
B) There will be a difference in aggression questionnaire scores between participants who listen to aggressive lyrics and participants who listen to non-aggressive lyrics.
C) There will be no difference in aggression questionnaire scores between participants who listen to aggressive lyrics and participants who listen to non-aggressive lyrics.
12. Ovulation and facial preference
A) Female participants who are ovulating will rate masculine male faces as more attractive than female participants who are not ovulating.
B) There will be a difference in attractiveness ratings of masculine and feminine male faces between ovulating and non-ovulating female participants.
C) There will be no difference in attractiveness ratings of masculine and feminine male faces between ovulating and non-ovulating female participants.
13. Television and creativity
A) Participants who watch television will produce lower creativity scores on a creativity task than participants who do not watch television.
B) There will be a difference in creativity task scores between participants who watch television and participants who do not watch television.
C) There will be no difference in creativity task scores between participants who watch television and participants who do not watch television.
14. Finger ratios and testosterone (risk taking)
A) There will be a positive correlation between 2D:4D finger length ratio and risk-taking scores on a risk-taking questionnaire.
B) There will be a relationship between the 2D:4D finger length ratio and risk-taking scores on a risk-taking questionnaire.
C) There will be no relationship between 2D:4D finger length ratio and risk-taking scores on a risk-taking questionnaire.
15. Gender and conformity
A) Female participants will give more conforming responses in a conformity task than male participants.
B) There will be a difference in conformity task scores between male and female participants.
C) There will be no difference in conformity task scores between male and female participants.
16. Gender and risk-taking behaviour (road play)
A) Male children will play on the road more frequently than female children, as measured by observational counts.
B) There will be a difference in the frequency of road play between male and female children.
C) There will be no difference in the frequency of road play between male and female children.
17. Sibling position and empathy
A) Older siblings will score higher on an empathy questionnaire than younger siblings.
B) There will be a difference in empathy questionnaire scores between older and younger siblings.
C) There will be no difference in empathy questionnaire scores between older and younger siblings.
18. Physiological arousal and attraction
A) Participants experiencing physiological arousal will rate photographs of the opposite sex as more attractive than participants not experiencing physiological arousal.
B) There will be a difference in attractiveness ratings of opposite sex photographs between participants experiencing physiological arousal and those who are not.
C) There will be no difference in attractiveness ratings of opposite sex photographs between participants experiencing physiological arousal and those who are not.
SECTION C: NON-EXPERIMENTAL METHODS
Research that does not establish cause and effect. (1 mark)
Name as many non-experimental research methods as you can.
(1 mark per correct answer, up to 7 marks)Define a case study. (2 marks)
Outline two strengths and two limitations of case studies. (4 marks)
Define a naturalistic observation
(2 marks)Name advantages of a naturalistic observation
(4 marks)Name disadvantages of a naturalistic observation
(4 marks)Define a controlled observation
(2 marks)Name advantages of a controlled observation
(4 marks)Name disadvantages of a controlled observation
(4 marks)What is an overt/disclosed observation?
(1 mark)Why would researchers choose an overt observation?
(2 marks)In what situations would a researcher choose a covert/non-disclosed observation?
(3 marks)Name as many ways that a researcher could disclose their identity in an observation
(1 mark for each method)What is a participant observation?
(1 mark)What is a non-participant observation?
(1 mark)Why would researchers choose either participant or non-participant observation?
(4 marks)A psychologist wants to study aggressive behaviour in a school playground.
Outline how a naturalistic observation could be carried out.
(4 marks)Explain one strength of using a naturalistic observation in this study.
(3 marks)Explain one limitation of using a naturalistic observation in this study.
(3 marks)A psychologist wants to study attachment behaviour in a laboratory playroom.
Outline how a controlled observation could be carried out.
(4 marks)Explain one strength of using a controlled observation in this study.
(3 marks)Explain one limitation of using a controlled observation in this study.
(3 marks)Two observers record the same behaviour independently.
Explain how inter-observer reliability could be assessed.
(4 marks)Behaviour is recorded every 30 seconds.
Identify the sampling technique being used.
(1 mark)Explain one limitation of this sampling technique.
(3 marks)Identify one ethical issue associated with covert observation.
(2 marks)Explain how this ethical issue could be dealt with.
(3 marks)Define time sampling and event sampling. (4 marks)
Explain one strength and one limitation of time sampling. (4 marks)
Explain one strength and one limitation of event sampling. (4 marks)
Define inter-rater reliability. (2 marks)
Explain why inter-rater reliability is particularly important in observational research. (3 marks)
Define content analysis. (2 marks).
Explain the difference between qualitative and quantitative content analysis. (4 marks)
Define thematic analysis. (2 marks)
Explain how themes are identified in thematic analysis. (3 marks)
Outline one strength and one limitation of thematic analysis. (4 marks)
ANSWERS SECTION C: NON-EXPERIMENTAL METHODS
Non-experimental research is research in which variables are not manipulated, therefore cause and effect cannot be established.
Non-experimental research methods include naturalistic observation, controlled observation, participant observation, non-participant observation, case study, interview, questionnaire, correlational study, content analysis, thematic analysis, and natural experiment (any seven).
A case study is an in-depth investigation of a single individual, group, event, or institution using multiple sources of data.
Strengths: case studies provide rich, detailed qualitative data and are useful for studying rare or unusual phenomena. Limitations: findings lack generalisability and cause and effect cannot be established.
A naturalistic observation involves observing behaviour in its natural environment without manipulating the environment.
Advantages include high ecological validity, natural and authentic behaviour, reduced demand characteristics, social desirability bias and usefulness where manipulation is unethical or impractical.
Disadvantages include lack of control over extraneous variables, observer bias, ethical issues, and reduced ability to replicate.
A controlled observation is conducted in a structured or artificial environment where some variables are controlled by the researcher.
Advantages include greater control, higher reliability, easier replication, and more precise measurement of behaviour.
Disadvantages include lower ecological validity, artificial behaviour, demand characteristics, and reduced generalisability.
An overt observation is one in which participants are aware they are being observed.
Researchers may choose an overt observation to obtain informed consent and avoid ethical issues such as deception.
A covert observation may be chosen when awareness would change behaviour, when studying socially undesirable behaviour, or when observation takes place in a public setting.
Researchers may disclose their identity through verbal briefing, information sheets, consent forms, ID badges, notices, or gatekeeper permission.
A participant observation is when the researcher becomes actively involved in the group being studied.
A non-participant observation is when the researcher observes behaviour without becoming involved.
Participant observation allows greater insight and access to behaviour and may increase validity, whereas non-participant observation reduces observer influence and increases objectivity.
The psychologist could observe children during break time and record aggressive acts using a behavioural checklist without interfering with behaviour.
A strength is high ecological validity because behaviour is observed naturally in a real playground, making findings more representative.
A limitation is lack of control over extraneous variables such as peer groups or supervision, making conclusions difficult.
The psychologist could observe children in a standardised laboratory playroom and record attachment behaviours using predefined behavioural categories.
A strength is high reliability because standardised conditions allow consistent measurement and comparison of behaviour.
A limitation is low ecological validity because behaviour in a laboratory may not reflect real-life attachment behaviour.
Inter-observer reliability can be assessed by comparing observers’ recordings and calculating percentage agreement or a correlation coefficient.
The sampling technique is time sampling.
A limitation of time sampling is that behaviours occurring outside the fixed intervals may be missed.
One ethical issue associated with covert observation is lack of informed consent.
This can be dealt with by observing only in public places, anonymising data, and debriefing participants afterwards where possible.
Time sampling involves recording behaviour at fixed time intervals, whereas event sampling involves recording every occurrence of a specified behaviour.
A strength of time sampling is reduced observer workload, while a limitation is that important behaviours may be missed between intervals.
A strength of event sampling is that all instances of the target behaviour are recorded, while a limitation is that frequent behaviours may be over-represented.
Inter-rater reliability is the extent to which different observers produce consistent ratings of behaviour.
It is particularly important because observations involve subjective judgement, and high inter-rater reliability increases objectivity and credibility of findings.
Content analysis is a research method used to systematically analyse communication by coding data into categories.
Quantitative content analysis counts the frequency of categories, whereas qualitative content analysis focuses on meaning and interpretation.
Thematic analysis is a method for identifying, analysing, and interpreting patterns or themes in qualitative data.
Themes are identified by coding the data, grouping similar codes together, and refining them into broader themes.
A strength of thematic analysis is that it provides rich insight into meaning and experience, while a limitation is that interpretation is subjective and may reduce reliability.
Non-experimental research
Research in which the researcher does not manipulate variables and therefore cannot establish cause and effect.Non-experimental methods (7 marks)
Any seven:
• Observational study
• Case study
• Correlational study
• Content analysis
• Interview
• Questionnaire
• Thematic analysis
• Discourse analysisDefine a case study (2 marks)
An in-depth investigation of a single individual, group, or event.Strengths and limitations of case studies (4 marks)
Strengths: rich, detailed data; useful for rare phenomena
Limitations: low generalisability; researcher biasDefine an observation (2 marks)
The systematic watching and recording of behaviour.Participant vs non participant observation (2 marks)
Participant: The researcher is involved in the group
Non-participant: researcher observes without involvementOvert vs covert observation (2 marks)
Overt: participants are aware they are being observed
Covert: participants are unaware they are being observedTime sampling and event sampling (4 marks)
Time sampling: behaviour recorded at fixed intervals
Event sampling: behaviour recorded whenever it occursTime sampling strengths and limitations (4 marks)
Strength: structured and systematic
Limitation: important behaviours may be missedEvent sampling strengths and limitations (4 marks)
Strength: captures target behaviours
SECTION D: CORRELATIONS
Define a correlation coefficient. (2 marks)
What numerical value represents a perfect positive correlation? (1 mark)
Draw and label a scatter plot showing a perfect positive correlation between two continuous variables. (4 marks)
What numerical value represents a perfect negative correlation? (1 mark)
Draw and label a scatter plot showing a perfect negative correlation between two continuous variables. (4 marks)
Outline two strengths and two limitations of correlations. (4 marks)
Holmes and Rahe reported a statistically significant correlation of +0.30 between life events and illness.
Explain what is meant by statistical significance in this context. (4 marks)State whether the following correlations are positive or negative: (23 Marks)
a. The more sweets I eat, the spottier I get.
b. The hotter the weather, the fewer clothes are worn.
c. The colder the weather, the higher the bills.
d. The more extroverted the person, the more party invitations they receive.
e. The more TV soaps watched, the greater the decline in IQ.
f. The more violent television is watched, the more aggressive the pupil becomes.
g. The more smoking is observed, the more likely you are to smoke.
h. The stricter the parent, the less aggressive the child.
i. As classroom noise diminishes, recall accuracy diminishes.
j. When outdoor temperature rises, heating costs fall.
k. As revision time tapers off, exam performance weakens.
l. When parental strictness eases, aggressive behaviour increases.
m. As sleep duration lengthens, concentration errors reduce.
n. When screen exposure escalates, reported anxiety intensifies.
o. As physical activity declines, resting heart rate increases.
p. When peer approval strengthens, independent decision making weakens.
q. As supervision becomes tighter, rule-breaking decreases.
r. When alcohol consumption drops, reaction speed improves.
s. As workload increases, job satisfaction weakens.
t. When confidence diminishes, reliance on reassurance increases.
u. As background distractions lessen, task persistence strengthens.
v. When motivation wanes, effort output declines.
w. As social interaction reduces, reported loneliness intensifies
ANSWERS SECTION D: CORRELATIONS
30. Correlation coefficient. (2 marks)
A correlation coefficient is a quantitative measure of the relationship between two variables, e.g., a numerical measure of the strength and direction of a relationship between variables (putting a number on how strong or weak a correlation is, for instance, 0.2)
31. Perfect positive correlation. (1 mark)
+1
32. Perfect positive scatter plot. (4 marks)
Two continuous variables
Correctly labelled axes
Straight upward line
33. Perfect negative correlation. (1 mark)
-1
34. Perfect negative scatter plot. (4 marks)
Straight downward line
Correct axes
35. Strengths and limitations of correlations. (4 marks)
ADVANTAGES
Researchers can establish if there is a significant relationship between two variables.
Good when experiments aren’t feasible (too many variables)
Good for preliminary research
Relationships are clear and easy to interpret in a scattergram.
Provide an unobtrusive form of data, so it can be used when it may be unethical to conduct an experiment.
Correlations don’t require manipulating behaviour, so they can be a quick and ethical method of data collection and analysis.
DISADVANTAGES
Correlations do not determine cause and effect. A third intervening variable may explain the results.
They identify only linear (straight-line) relationships.
36. Holmes & Rahe found a significant correlation of +0.30 in their study on stress using the Social Readjustment Rating Scale (SRRS). Although the correlation was small, it was statistically significant and reliable. What does this mean? (4 marks).
Answer: It means that although the correlation is small, it is statistically significant (e.g., the result is unlikely to have occurred by chance, meaning the result did not occur by chance. Although a significant correlation existed, it was too small to be considered the sole factor in the relationship; that is, something other than life events was causing stress among the participants in Rahe and Holmes’s study.
37. State whether the following correlations are positive or negative: (23 Marks)
a..The more sweets I eat, the spottier I get: Positive correlation
b. The hotter the weather, the fewer clothes are worn: Negative correlation
c. The colder the weather, the higher the bills: Negative correlation
d. The more extroverted the person, the more party invitations they receive: Positive correlation
e. The more TV soaps watched, the greater the decline in IQ: Negative correlation
f. The more violent television is watched, the more aggressive the pupil becomes: Positive correlation
g. The more smoking is observed, the more likely you are to smoke: Positive correlation
h. The stricter the parent, the less aggressive the child: Negative correlation
i. As classroom noise diminishes, recall accuracy diminishes: Positive correlation
j. When outdoor temperature rises, heating costs fall: Negative correlation
k. As revision time tapers off, exam performance weakens: Positive correlation
l. When parental strictness eases, aggressive behaviour increases: Negative correlation
m. As sleep duration lengthens, concentration errors reduce: Negative correlation
n. When screen exposure escalates, reported anxiety intensifies: Positive correlation
o. As physical activity declines, resting heart rate increases: Negative correlation
p. When peer approval strengthens, independent decision making weakens: Negative correlation
q. As supervision becomes tighter, rule-breaking decreases: Negative correlation
r. When alcohol consumption drops, reaction speed improves: Negative correlations.
s.As workload increases, job satisfaction weakens: Negative correlation
t. When confidence diminishes, reliance on reassurance increases: Negative correlation
u. As background distractions lessen, task persistence strengthens: Negative correlation
v. When motivation wanes, effort output declines: Positive correlation
w As social interaction reduces, reported loneliness intensifies: Negative correlation
SECTION E: GRAPHS, DATA, AND LEVELS OF MEASUREMENT
MEASURES OF CENTRAL TENDENCY AND DISPERSION
QUESTIONS
Interpreting Quantitative Data: Mean and Range
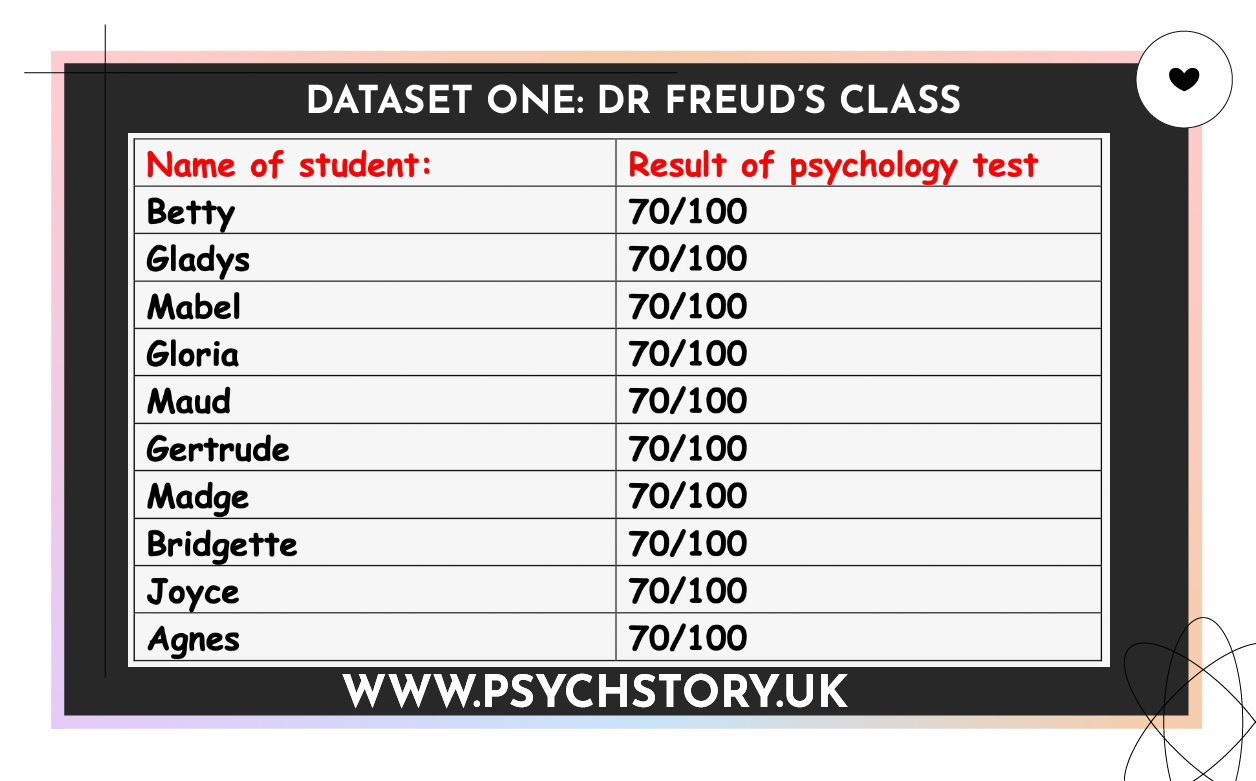
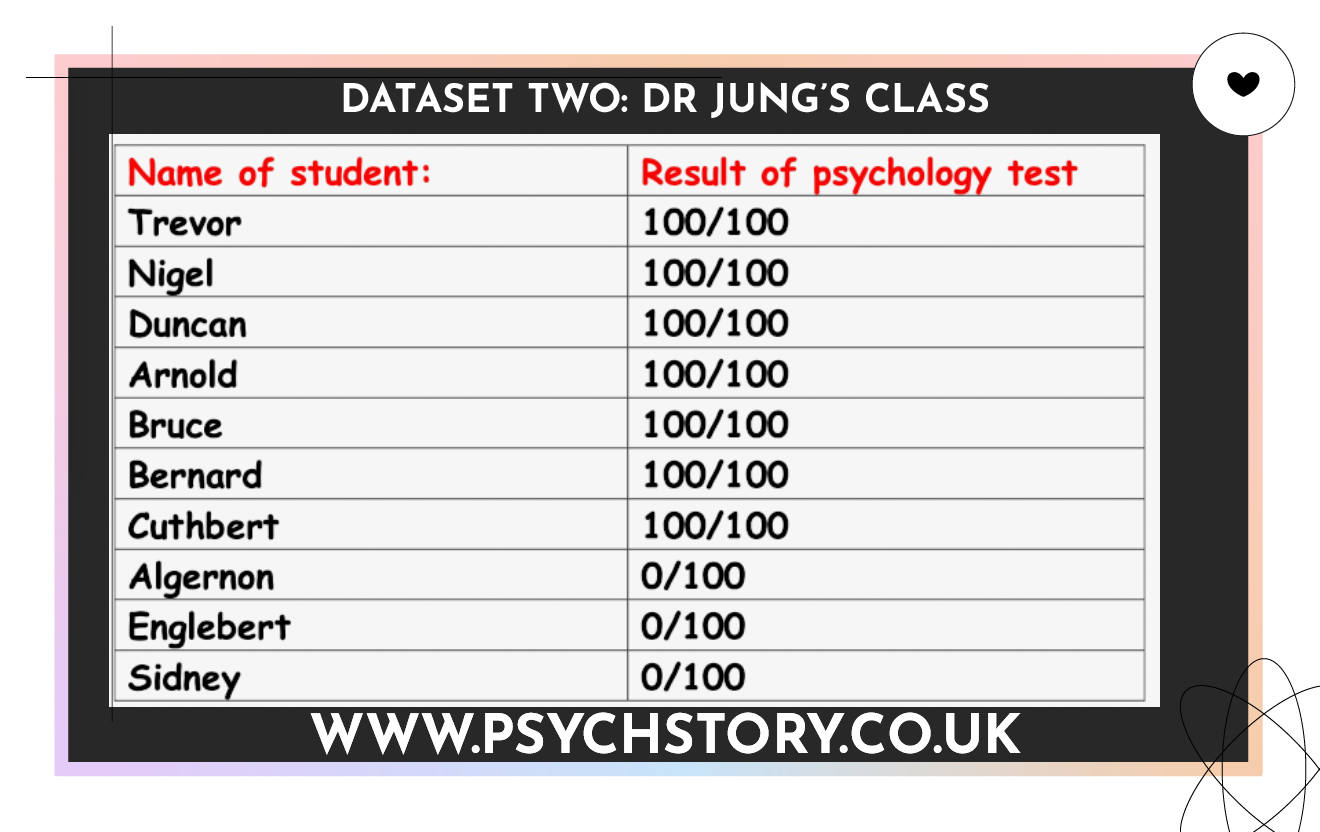
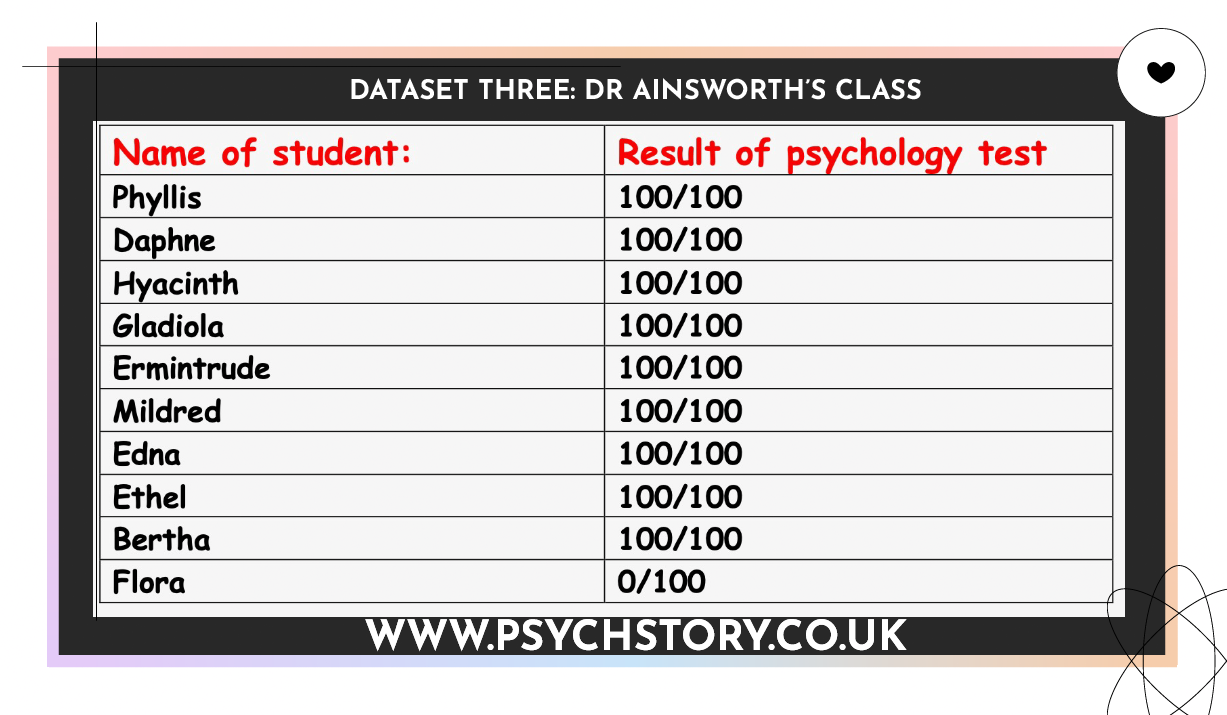
The following datasets present the results of a psychology test, scored out of 100, administered to four classes.
Question 1: Mean (Central Tendency)
The mean score is often used as a summary measure of typical performance.
a) Calculate the mean score for each of the following classes:
Dataset One: Dr Freud’s class
Dataset Two: Dr Jung’s class
Dataset Three: Dr Ainsworth’s class
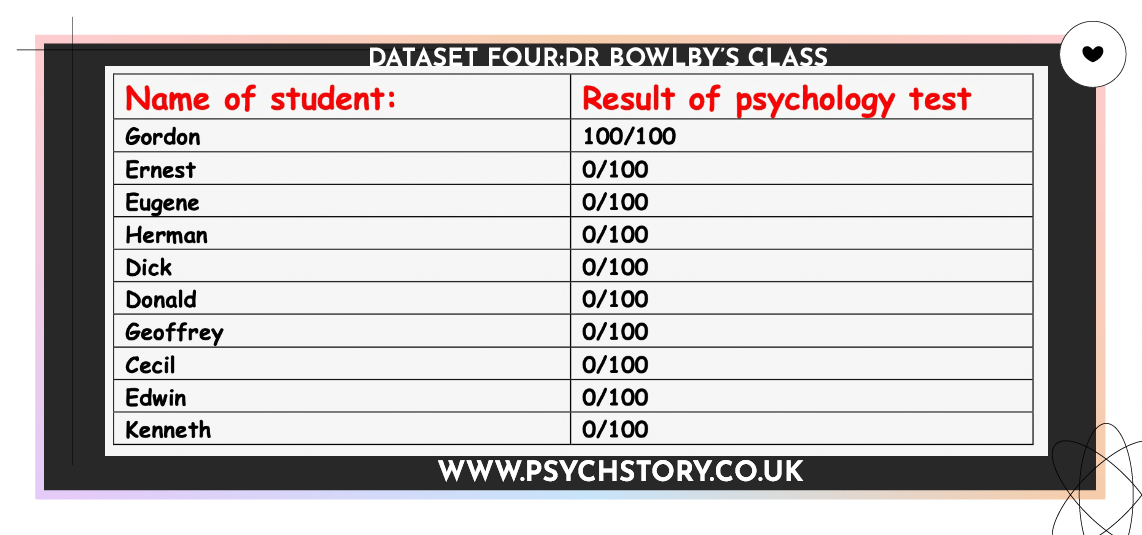
Dataset Four: Dr Bowlby’s class
b) Based only on the mean, which classes appear to show similar overall performance?
c) Explain why relying on the mean alone may lead to misleading conclusions about performance.
Question 2: Range (Dispersion)
The range is a measure of dispersion that indicates the spread of scores within a dataset.
a) Calculate the range for each of the four datasets.
b) Identify any datasets that have the same range.
c) Explain why the range alone is insufficient for evaluating typical performance within a class.
Question 3: Mean and Range Together
a) Compare Dataset One (Dr Freud’s class) and Dataset Two (Dr Jung’s class), which have the same mean.
Explain how the range alters the interpretation of their performance.
b) Compare Dataset Three (Dr Ainsworth’s class) and Dataset Four (Dr Bowlby’s class), which have the same range.
Explain how the mean alters the interpretation of their performance.
Question 4: Evaluation
Using evidence from all four datasets, explain why psychologists should always use a measure of central tendency together with a measure of dispersion when interpreting quantitative data.
LEVELS OF MEASUREMENT
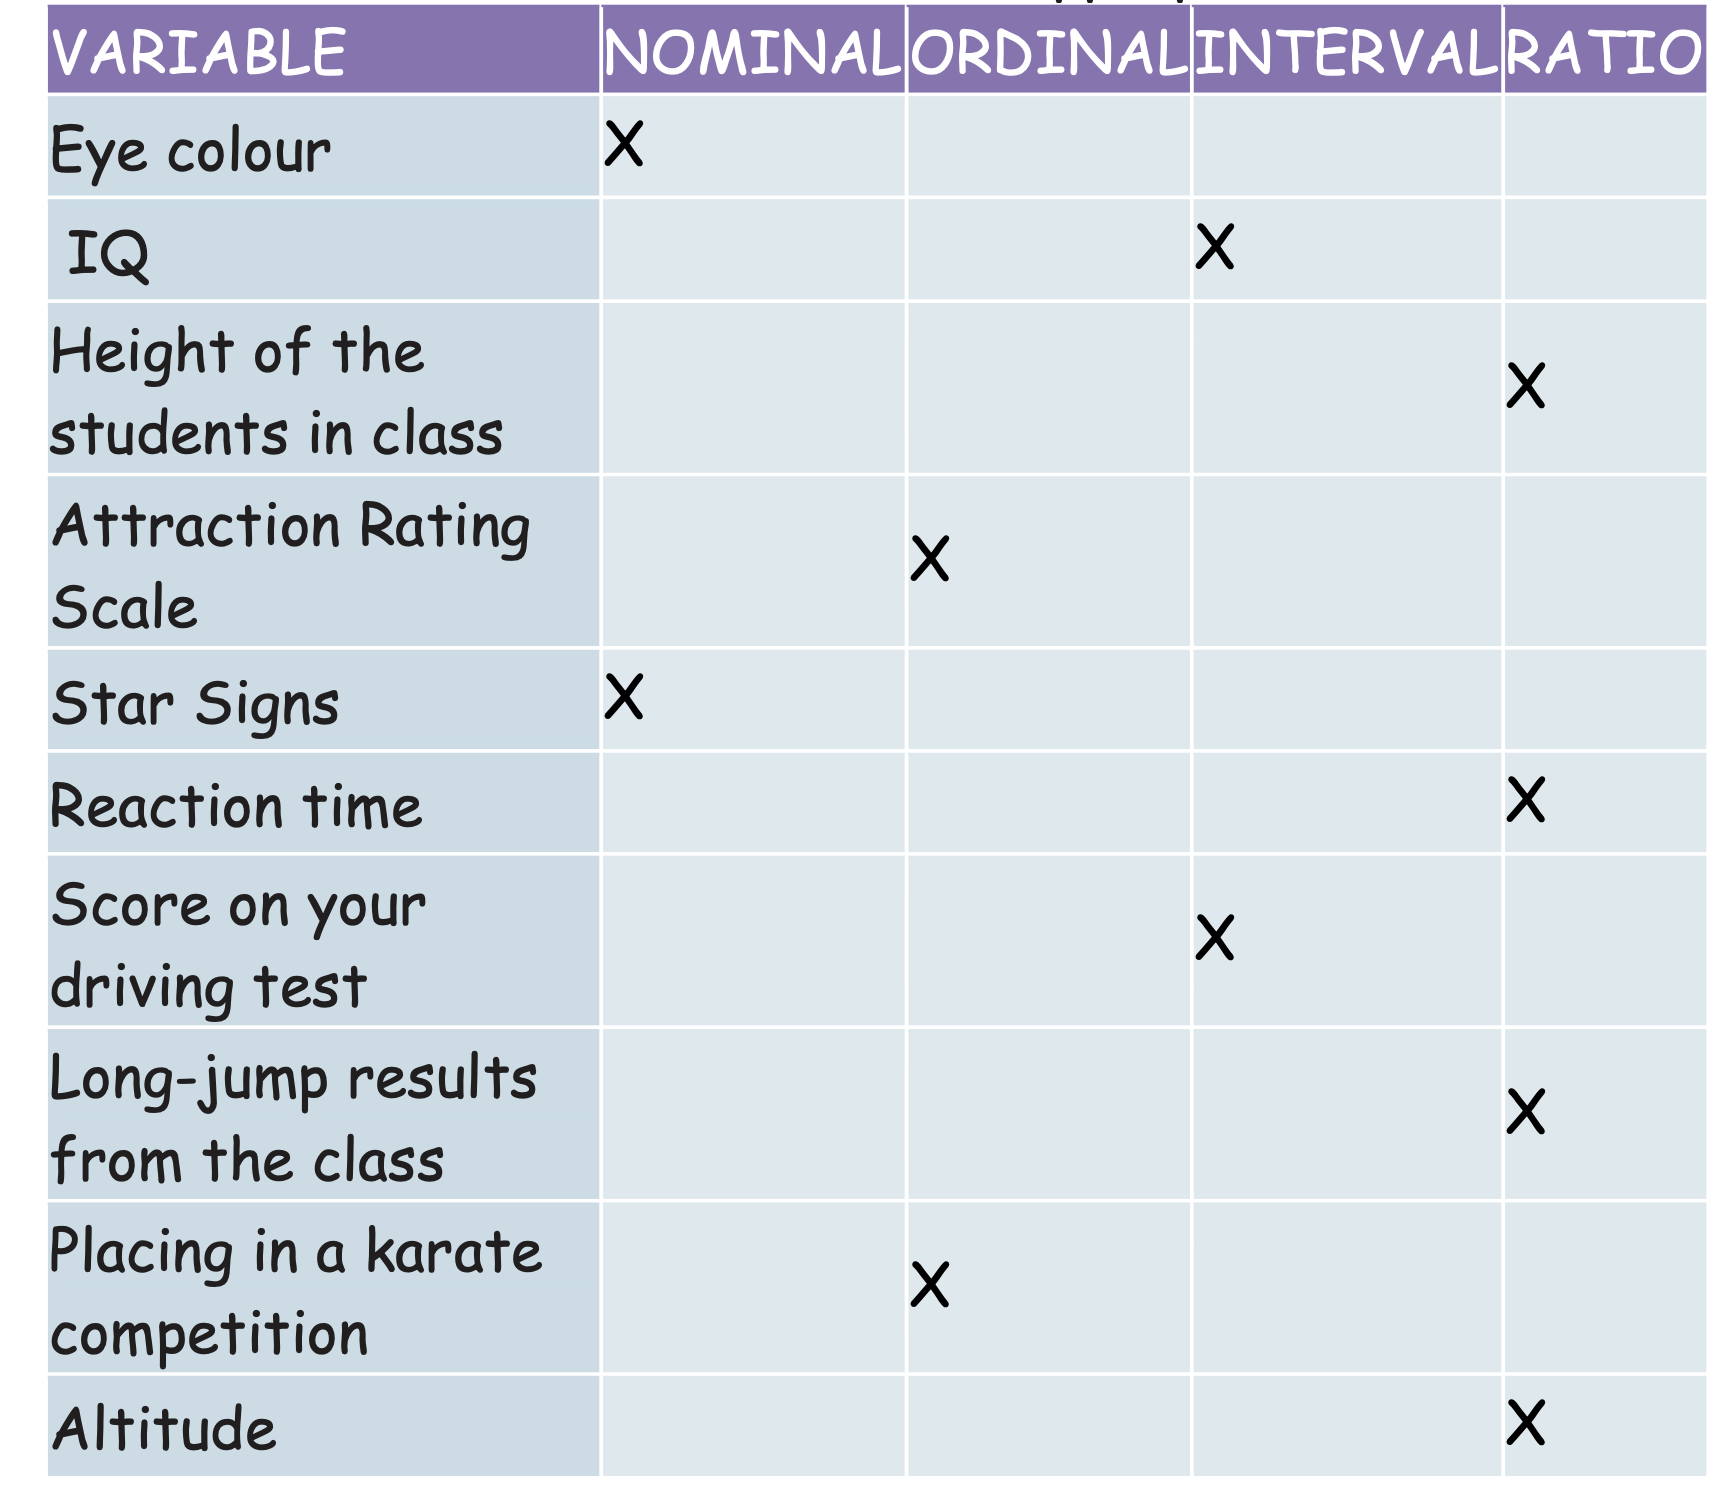
Name the four levels of measurement. (4 marks)
2. Explain why histograms must only be used with continuous data. (4 marks)
3. Explain why bar charts and pie charts are not suitable for continuous data. (4 marks)
4. A psychologist collects the following data. (16 marks)
For each variable:
i) Identify the level of measurement
ii) State one appropriate type of graph
iii) State the most appropriate measure of central tendency
iv) State the most appropriate measure of dispersion
a) Gender of participants
b) Anxiety score measured using a Likert scale
, e.g., not anxious / slightly anxious / neither anxious nor unanxious / quite anxious / extremely anxious
c) Reaction time measured in milliseconds
d) Type of phobia, e.g., social phobia, arachnophobia, claustrophobia, agoraphobia
RESULTS: SECTION E: GRAPHS, DATA, AND LEVELS OF MEASUREMENT
1.Levels of measurement. (4 marks)
Nominal
Ordinal
Interval
Ratio
2. Why histograms are only suitable for certain kinds of data (levels of measurement) (4 marks)
No gaps between bars
Data has true numerical order.
Uses class intervals.
Area represents frequency.
4. Why bar/pie charts are only suitable for certain kinds of data (levels of measurement). (4 marks)
Separate categories
Gaps imply discontinuity.
Cannot represent distributions.
5. A psychologist collects the following data. (16 marks)
For each variable:
i) State the level of measurement
ii) State one appropriate graph
iii) State the most appropriate measure of central tendency
iv) State the most appropriate measure of dispersion
a) Gender of participants
Level of measurement: Nominal
Graph: Bar chart or pie chart
Central tendency: Mode
Dispersion: None appropriate
b) Anxiety score measured as ranked levels (eg low to very high)
Level of measurement: Ordinal
Graph: Bar chart
Central tendency: Median
Dispersion: Range
c) Reaction time measured in milliseconds
Level of measurement: Ratio
Graph: Histogram
Central tendency: Mean
Dispersion: Standard deviation
d) Type of phobia
Level of measurement: Nominal
Graph: Bar chart or pie chart
Central tendency: Mode
Dispersion: None appropriate
SECTION F: TYPES OF DATA
Outline four strengths of qualitative data. (4 marks)
Outline four limitations of qualitative data. (4 marks)
Outline four strengths of quantitative data. (4 marks)
Outline four limitations of quantitative data. (4 marks)
SECTION F: TYPES OF DATA
1. Strengths of qualitative data. (4 marks)
Rich detail
High validity
Idiographic
Participant perspective
2. Limitations of qualitative data. (4 marks)
Time-consuming
Researcher bias
Low reliability
Difficult to analyse.
3. Strengths of quantitative data. (4 marks)
Objective
Easy analysis
Comparisons
Large samples
4. Limitations of quantitative data. (4 marks)
Reductionist
Low validity
Lacks depth.
Forced responses.
SECTION G: RELIABILITY AND VALIDITY
Define reliability. (2 marks)
Define internal reliability. (2 marks)
Define external reliability. (2 marks)
Outline three ways reliability can be assessed in psychological research. (3 marks)
Define internal validity. (3 marks)
Identify five threats to internal validity. (5 marks)
Define external validity. (3 marks)
Give four factors that affect external validity. (4 marks)
Define operationalisation. (2 marks)
Define zeitgeist and explain its significance in psychological research. (4 marks)
RESULTS SECTION G: RELIABILITY AND VALIDITY
1. Reliability. (2 marks)
Consistency of a measure.
2. Internal reliability. (2 marks)
Consistency within a test.
3. External reliability. (2 marks)
Consistency over time or among observers.
4. Assessing reliability. (3 marks)
Test-retest; inter-rater; split-half.
5 Internal validity. (3 marks)
Whether the IV caused the DV without threats to internal validity.
6. Threats to internal validity. (5 marks)
Any five:
Demand characteristics
Experimenter bias
Order effects
Confounding variables
Poor operationalisation
Social desirability bias
The Hawthorne effect
Investigator effects
7. External validity. (3 marks)
Generalisation to other people, places, and times. (ecological validity, mundane realism, population validity, temporal validity
8. Factors affecting external validity. (4 marks)
Population, ecological, temporal, mundane realism.
9. Operationalisation. (2 marks)
Defining variables in measurable terms.
10. Zeitgeist. (4 marks)
Spirit of the age
Cultural context
Limits generalisation
Leads to temporal bias.
SECTION H: DESCRIPTIVE STATISTICS
Describe the three measures of central tendency. (6 marks)
Give one strength and one limitation of each measure of central tendency. (6 marks)
Describe the three measures of dispersion. (6 marks)
Give one strength and one limitation of each measure of dispersion. (6 marks)
RESULTS SECTION H: DESCRIPTIVE STATISTICS
1. Central tendency. (6 marks)
Mean, median, and mode with definitions.
2. Strengths and limitations. (6 marks)
Mean: sensitive/outliers
Median: resistant/less sensitive
Mode: nominal/limited use
3. Dispersion. (6 marks)
Range, standard deviation, and inter-quartile range.
4. Strengths and limitations. (6 marks)
SD sensitive; range affected by outliers; IQR ignores extremes.
SECTION I: SAMPLING
Name as many sampling techniques as you can.
(1 mark per correct technique)For EACH sampling technique named, give one strength and one limitation. (additional marks)
RESULTS SECTION I: SAMPLING
1.Sampling techniques. (1 mark each)
Random Sample
Opportunity Sample
Volunteer Sample
Stratified Sample
Snowball.Sample
2. Strengths and limitations.
Correct pairing per method.
SECTION J: ERROR AND SIGNIFICANCE
Define constant (systematic) error. (2 marks)
Define random error. (2 marks)
Define a Type I error. (2 marks)
Define a Type II error. (2 marks)
Explain why psychologists usually use a significance level of p ≤ 0.05. (4 marks)
Explain one problem associated with using a very strict significance level (e.g. p ≤ 0.01). (3 marks)
Explain one problem associated with using a very lenient significance level (e.g. p ≤ 0.10). (3 marks
8. Explain what is meant by the phrase “not statistically significant at the 10% level.” (2 marks)
9. Explain how the set significance level affects the likelihood of making a Type 1 error or a Type 2 error. (4 marks)
10. Explain what is meant by “p ≤ 0.05”. (2 marks)
ANSWERS: SECTION J: ERROR AND SIGNIFICANCE
1. Define constant (systematic) error. (2 marks)
Constant (systematic) error refers to a consistent bias in measurement that affects results in the same direction every time.
It is caused by flaws in equipment, procedures, or researcher bias, leading to data that are consistently inaccurate, even when they appear reliable.
2. Define random error. (2 marks)
Random error refers to unpredictable fluctuations in data caused by chance variables, such as participant differences or environmental changes.
These errors vary from trial to trial and reduce the precision of results, but do not bias them in a single direction.
3.Define a Type I error. (2 marks)
A Type I error occurs when the researcher incorrectly rejects the null hypothesis, concluding that there is a significant effect when, in reality, no true effect exists.
This is also known as a false positive.
4. Define a Type II error. (2 marks)
A Type II error occurs when the researcher incorrectly fails to reject the null hypothesis, concluding that there is no significant effect when, in reality, a true effect exists.
This is also known as a false negative.
5. Explain why psychologists usually use a significance level of p ≤ 0.05. (4 marks)
Psychologists use a significance level of p ≤ 0.05 because it indicates a probability of 5% or less that the results occurred by chance. This level represents a balance between being too lenient (risking Type I errors) and too strict (risking Type II errors).
It provides an accepted, standardised threshold for determining whether results are statistically significant.
Using p ≤ 0.05, therefore, increases confidence in findings while keeping error rates at an acceptable level.
6. Explain one problem associated with using a very strict significance level (e.g. p ≤ 0.01). (3 marks)
Using a very strict significance level reduces the likelihood of a Type I error and, in turn, the number of false positives.
However, it increases the risk of a Type II error, in which a real effect goes undetected.
This means that genuine findings may be missed, thereby reducing the research's sensitivity.
7. Explain one problem associated with using a very lenient significance level (e.g. p ≤ 0.10). (3 marks)
Using a lenient significance level increases the likelihood of detecting an effect, reducing the risk of Type II errors. However, it greatly increases the risk of Type I errors, meaning results may appear significant when they are actually due to chance. This weakens the credibility and reliability of the conclusions drawn.
Type 1 and Type 2 Errors
8. Explain what is meant by the phrase “not statistically significant at the 10% level.” (2 marks)
If the results are statistically significant, they are unlikely to have occurred by chance, and the researcher can reject the null hypothesis and accept the experimental or alternative hypothesis. If the results are not statistically significant at the 10% level, this indicates that there is more than a 10% probability that the observed results occurred by chance; therefore, the null hypothesis is retained.
9. How does the set significance level affect the chance of researchers getting a Type 1 or Type 2 error? (4 marks)
If psychologists set the significance level at 10%, they are more likely to commit a Type I error because the chance of a false positive is higher. This means the researcher may reject the null hypothesis when it should have been retained.
If psychologists set the significance level at 1%, they are more likely to commit a Type II error because the criteria for significance are very strict. This means they may retain the null hypothesis even when there is a true effect.
As a result, psychologists typically use a 5% significance level because it balances the risk of Type I and Type II errors.
10. Explain what is meant by “p ≤ 0.05”. (2 marks)
p ≤ 0.05 means that the probability of the results occurring by chance is 5% or less. This means the results are statistically significant and the null hypothesis can be rejected, with the researcher being 95% confident that the effect is not due to chance
SECTION K KEY FEATURES OF SCIENCE
1) Discuss the extent to which this psychologist’s research is scientific. Refer to the key features of science in your answer. (8 marks)
A researcher sought to compare the effectiveness of two therapies for individuals with a fear of flying. A newspaper advertisement was used to recruit a sample of fifty volunteers who were afraid of flying. The participants were randomly allocated to Therapy A (Group 1) or Therapy B (Group 2). Each participant’s anxiety about flying was measured before and after therapy using an Anxiety Scale on which participants rated how they felt at the time. A high score indicated extreme anxiety, and a low score indicated mild anxiety.
For the pre-therapy assessment, all participants experienced realistic pre-flight conditions in an airport terminal and on board an aircraft. Although participants expected the plane to take off, it remained on the ground. Once the engines were turned off, participants completed the Anxiety Scale on board the aircraft.
Participants then attended weekly sessions of either Therapy A or Therapy B for four weeks. At the end of this period, they underwent the same procedure as the pre-therapy assessment and completed the Anxiety Scale again as a post-therapy assessment.
2) Discuss the extent to which this teacher’s research is scientific. Refer to the key features of science in your answer. (8 marks)
A teacher at a small country secondary school observed that some students frequently used a computer for homework. She suspected that these students tended to achieve better results and wondered whether computer use improved school achievement.
She interviewed a small sample of 30 students, asking about their after-school activities and their willingness to participate in the study. She attempted to include a range of students, including those who were less cooperative, to ensure a fair sample.
The teacher asked whether the students had access to a computer, how long they spent using it each day, and whether it was used for homework. She also examined each student’s exam grades from the previous year and conducted statistical comparisons.
The teacher found that the more time students spent using computers, the worse their exam results tended to be. She concluded that research into computers and learning was flawed and that schools investing heavily in computer facilities were wasting money. She developed a new theory that traditional teaching methods were more effective.
3. 3. Explain why the teacher’s personal opinion cannot be accepted as scientific evidence. Refer to some of the major features of science in your answer. (6 marks)
A teacher has worked in the same primary school for two years. While speaking with the children, she is concerned to find that most of them come to school without having had a healthy breakfast. In her opinion, children who eat ‘a decent breakfast’ learn to read more quickly and are better behaved than children who do not. She now wants to establish a preschool breakfast club for the children so that they can all have a beneficial start to the day. The local authority is unwilling to fund this project solely on the teacher’s opinion and insists on scientific evidence for the claimed benefits of eating a healthy breakfast.
ANSWERS SECTION K KEY FEATURES OF SCIENCE
1. Discuss the extent to which this psychologist’s research is scientific. (8 marks)
(Fear of flying therapies study)
The research demonstrates several key features of a scientific approach. The study is empirical, as it collects quantitative data using an anxiety scale both before and after therapy. Anxiety is operationalised using a standardised scale, thereby increasing objectivity and enabling scores to be compared across conditions. The use of random allocation to Therapy A and Therapy B reduces participant-related variables and increases internal validity, a key feature of controlled scientific investigation.
The procedure is also standardised, as all participants experienced the same pre-flight and post-flight conditions. This increases replicability, allowing other researchers to replicate the study and assess reliability. The pre-test and post-test design allows for tentative cause-and-effect conclusions about the effectiveness of the therapies, thereby strengthening their scientific status.
However, limitations constrain the extent to which the research is fully scientific. Anxiety is measured using self-report, which is subjective and vulnerable to demand characteristics and social desirability bias. This reduces objectivity. In addition, the sample comprises volunteers recruited through a newspaper advertisement, which may introduce volunteer bias and limit generalisability.
Overall, the study demonstrates a strong degree of scientific rigour through control, operationalisation, and replicability; however, reliance on self-report data and a volunteer sample means it is not entirely objective. Therefore, the research is largely but not completely scientific.
2. Discuss the extent to which this teacher’s research is scientific. (8 marks) (Computers and learning study)
The teacher’s research lacks scientific rigour. On the positive side, the study is empirical, as it collects real data on computer use and exam grades. The use of statistical analysis to examine the relationship between time spent on computers and academic performance reflects a scientific attempt to identify patterns in data. The findings are also falsifiable, as the teacher’s original belief that computers improve learning was contradicted by the results.
However, the research lacks several key features of science. There is no control for extraneous variables, such as socioeconomic status, motivation, or type of computer use, which could explain the results. This prevents any causal conclusions and weakens internal validity. The sample is small and opportunity-based, and the teacher deliberately selected certain types of pupils, introducing researcher bias and reducing objectivity.
The method relies heavily on interviews, which are subjective and difficult to replicate, reducing reliability. There is also evidence of confirmation bias after the results were obtained, as the teacher exaggerated the implications of the findings and developed a broad theory based on insufficient evidence. The study lacks standardisation and cannot be easily replicated by other researchers.
Overall, although the research includes elements of scientific rigour, such as data collection and statistical analysis, the lack of control, objectivity, and replicability renders it weakly scientific.
3. Answer: Candidates must demonstrate an understanding of the distinction between opinion and scientific evidence. They could mention some of the following:
• The teacher has only experienced one school in a particular catchment area, so she has only observed a very limited number of 5-year-olds (issues of sampling and replicability).
• She has found out that children do not eat anything nourishing simply by chatting with them. She has no corroborating evidence from, e.g., parents (issues of objectivity).
• She uses vague phrases such as 'decent breakfast' without being clear what this means (operationalisation).
• She has generated a theory and made predictions based on flimsy evidence.
• She has not used any scientific method to lead to her conclusions, e.g. a carefully controlled experiment, survey or observation.
• She has drawn conclusions about the effects of breakfast without considering other variables which might affect reading skills and behaviour
SECTION L: PEER REVIEW
After carrying out the original study, the researcher sends off her research report for peer review
Briefly outline what should be included in a report of a psychological investigation (4 marks)
Discuss the role of the peer review (7 marks)
ANSWERS SECTION L: PEER REVIEW
2. Briefly outline what should be included in a report of a psychological investigation (4 marks)
A psychological research report should include an abstract summarising the study, an introduction outlining background research and the hypothesis, a method section detailing participants, design, materials, and procedure, and a results section presenting analysed findings. It should also include a discussion of the results, consideration of limitations, and a relation of the findings to existing research, followed by references and any appendices.
2. Discuss the role of peer review (7 marks)
Peer review is the process by which psychologists submit unpublished research to other psychologists for evaluation before publication. Reviewers are typically experts in the same field, enabling informed judgments about the quality, validity, and significance of the research.
A key strength of peer review is its role as a quality-control mechanism. Qualified psychologists can identify research that is unethical, methodologically flawed, invalid, or unreliable, preventing poor research from entering the scientific literature. Peer review also helps researchers in the same field stay up to date with current developments through journals and academic publications.
However, peer review has several limitations. Some research may be so novel or specialised that there are no true experts available to review it effectively. In addition, reviewers may not be neutral peers but rather competitors working in the same area, leading to biased criticism driven by professional rivalry, jealousy, or fear of losing credibility.
Peer review can also distort the scientific literature because studies that support the null hypothesis are often rejected, creating publication bias and giving a misleading impression of strong effects within a research area. There is also evidence of institutional and gender bias, with research by male researchers or from elite universities, such as Russell Group or Ivy League institutions, favoured.
Finally, research that challenges dominant approaches within psychology may be rejected, thereby making it difficult for radical or innovative ideas to be published. This limits theoretical diversity and slows scientific progress.
Overall, peer review plays an important role in maintaining research standards, but it is not free from bias and should not be seen as a guarantee of scientific quality.
SECTION M: INFERENTIAL STATISTICS
OBSERVED AND CRITICAL VALUES
What is meant by the term critical value?
State two things that are always needed in order to find the critical value.
In addition to the two factors above, state the third factor that is needed to find the critical value and explain when each is used:
(a) Degrees of freedom (df)
(b) N
(c) N1 and N2How are degrees of freedom (df) calculated for a chi-square test?
For each of the following statistical tests, state whether df, N, or N1 and N2 are required:
•Sign Test
• Mann–Whitney U test
• Related t-test
• Unrelated t-test
• Spearman’s rho
• Wilcoxon signed-rank test
• Chi-square testExplain how the observed value and critical value are used together to decide whether results are statistically significant.
Using critical value tables, decide whether the following observed values are statistically significant at p = 0.05:
a) Rho = 0.410 for a one-tailed test where N = 20
b) Rho = 0.50 for a two-tailed test where N = 10
c) χ² = 3.24 for a two-tailed test with a 2 × 2 contingency table
d) χ² = 5.00 for a one-tailed test with a 3 × 2 contingency table
e) U = 16 for a one-tailed test with 9 participants in one group and 8 in the other
f) U = 76 for a two-tailed test with 30 participants split equally between two conditions
g) T = 54 for a one-tailed test with 25 participants
h) T = 105 for a two-tailed test with 20 participants
MORE PRACTICE QUESTIONS (QUESTIONS ONLY)
Using your set of critical/table values, decide whether the alternative/experimental hypothesis should be accepted or rejected and explain why.
Use the following structure:
At the ______ level of significance, the critical/table value for a ______ tailed test, when ______ = ______ is ______.
Since the observed value of ______ is ______ which is ______ than the critical value, the ______ hypothesis can be ______ and the ______ hypothesis can be ______.
8. Wilcoxon Matched Pairs test, N = 12, directional hypothesis at p ≤ 0.05, T = 27
9. Mann–Whitney U test, non-directional hypothesis at p ≤ 0.10, N1 = 17 and N2 = 15, U = 54
10. Chi-square test, non-directional hypothesis at p ≤ 0.05, df = 10, χ² = 22.42
11. Spearman’s rho, non-directional hypothesis at p ≤ 0.10, N = 25, r = 0.511
12. Mann–Whitney U test, directional hypothesis at p ≤ 0.05, N1 = 16 and N2 = 19, U = 97
13. Chi-square test, non-directional hypothesis at p ≤ 0.10, df = 36, χ² = 50.00
14. Spearman’s rho, directional hypothesis at p ≤ 0.05, N = 11, r = 0.421
15. Mann–Whitney U test, directional hypothesis at p ≤ 0.05, N1 = 20 and N2 = 20, U = 136
16. Chi-square test, non-directional hypothesis at p ≤ 0.10, df = 27, χ² = 45.78
17. Spearman’s rho, directional hypothesis at p ≤ 0.05, N = 19, r = 0.39
18. Mann–Whitney U test, non-directional hypothesis at p ≤ 0.10, N1 = 12 and N2 = 13, U = 39
19. Chi-square test, non-directional hypothesis at p ≤ 0.05, df = 14, χ² = 18.17
20. Spearman’s rho, directional hypothesis at p ≤ 0.05, N = 11, r = 0.421
21. Unrelated t-test, non-directional hypothesis at p ≤ 0.05, df = 18, t = 1.92
22. Unrelated t-test, directional hypothesis at p ≤ 0.05, df = 22, t = 1.65
23. Unrelated t-test, non-directional hypothesis at p ≤ 0.10, df = 28, t = 1.55
24. Related t-test, directional hypothesis at p ≤ 0.05, df = 11, t = 2.05
25. Related t-test, non-directional hypothesis at p ≤ 0.05, df = 15, t = 1.80
26. Related t-test, directional hypothesis at p ≤ 0.10, df = 19, t = 1.42
27. Pearson’s product-moment correlation, non-directional hypothesis at p ≤ 0.05, df = 10, r = 0.61
28. Pearson’s product-moment correlation, directional hypothesis at p ≤ 0.05, df = 18, r = 0.42
29. Pearson’s product-moment correlation, non-directional hypothesis at p ≤ 0.10, df = 28, r = 0.31
30. Pearson’s product-moment correlation, directional hypothesis at p ≤ 0.01, df = 12, r = 0.70
RESULTS SECTION M: INFERENTIAL STATISTICS
OBSERVED AND CRITICAL VALUES
What is meant by the term critical value?
The critical value is the cut-off point that the observed value must reach or exceed (or be smaller than, depending on the test) in order for the null hypothesis to be rejected.State two things that are always needed to find the critical value.
• The significance level (e.g., 0.10, 0.05, 0.01)
• Whether the hypothesis is one-tailed or two-tailedState the third factor needed to find the critical value and explain when each is used.
(a) Degrees of freedom (df) – used for chi-square tests.
(b) N – used for Spearman’s rho correlations and Wilcoxon signed-rank tests (repeated measures or matched pairs).
(c) N1 and N2 – used for Mann–Whitney U tests with two independent groups.How are degrees of freedom calculated for a chi-square test?
(df) = (number of rows − 1) × (number of columns − 1)Which value is required for each statistical test?
•Sign test = N
• Mann–Whitney U test = N1 and N2
• Wilcoxon signed-rank test = N
• Related t-test = df (df = N − 1)
• Unrelated t-test = df (df = N1 + N2 − 2)
• Spearman’s rho = N
• Pearson’s product-moment correlation = df (df = N − 2)
• Chi-square test = df = (number of rows − 1) × (number of columns −How are the observed value and the critical value used together?
The observed value calculated from the data is compared to the critical value from the statistical table. If the observed value meets the criteria for significance (greater than or smaller than the critical value, depending on the test), the null hypothesis is rejected. If not, the null hypothesis is retained.Decide whether each observed value is statistically significant at p = 0.05.
a) Rho = 0.410, one-tailed, N = 20
Significant
b) Rho = 0.50, two-tailed, N = 10
Not significant
c) χ² = 3.24, two-tailed, 2 × 2 table
Not significant
d) χ² = 5.00, one-tailed, 3 × 2 table
Significant
e) U = 16, one-tailed, N1 = 9, N2 = 8
Significant
f) U = 76, two-tailed, N = 30 split equally
Not significant
g) T = 54, one-tailed, N = 25
Significant
h) T = 105, two-tailed, N = 20
Not significant
9. Wilcoxon Matched Pairs, N = 12, directional, p ≤ 0.05, T = 27
At the 5% level of significance, the critical value for a one-tailed test when N = 12 is 17.
Since the observed value of T is 27, which is greater than the critical value, the experimental hypothesis is rejected, and the null hypothesis is accepted.
10. Mann–Whitney U, non-directional, p ≤ 0.10, N1 = 17, N2 = 15, U = 54
At the 10% level of significance, the critical value for a two-tailed test when N1 = 17 and N2 = 15 is 83.
Since the observed value of U is 54, which is less than the critical value, the experimental hypothesis is accepted, and the null hypothesis is rejected.
11. Chi-square, non-directional, p ≤ 0.05, df = 10, χ² = 22.42
At the 5% significance level, the critical value for df = 10 is 18.31.
Since the observed value of χ² is 22.42, which is greater than the critical value, the alternative hypothesis is accepted, and the null hypothesis is rejected.
12. Spearman’s rho, non-directional, p ≤ 0.10, N = 25, r = 0.511
At the 10% level of significance, the critical value for a two-tailed test when N = 25 is 0.337.
Since the observed value of r is 0.511, which is greater than the critical value, the alternative hypothesis is accepted, and the null hypothesis is rejected.
13. Mann–Whitney U, directional, p ≤ 0.05, N1 = 16, N2 = 19, U = 97
At the 5% level of significance, the critical value for a one-tailed test is 101.
Since the observed value of U is 97, which is less than the critical value, the experimental hypothesis is accepte,d and the null hypothesis is rejected.
14. Chi-square, non-directional, p ≤ 0.10, df = 36, χ² = 50.00
At the 10% significance level, the critical value for df = 36 is 49.80.
Since the observed value of χ² is 50.00, which is greater than the critical value, the alternative hypothesis is accepted, and the null hypothesis is rejected.
15. Spearman’s rho, directional, p ≤ 0.05, N = 11, r = 0.421
At the 5% level of significance, the critical value for a one-tailed test when N = 11 is 0.536.
Since the observed value of r is 0.421, which is less than the critical value, the alternative hypothesis is rejected, and the null hypothesis is accepted.
16. Mann–Whitney U, directional, p ≤ 0.05, N1 = 20, N2 = 20, U = 136
At the 5% level of significance, the critical value for a one-tailed test is 138.
Since the observed value of U is 136, which is less than the critical value, the experimental hypothesis is accepted, and the null hypothesis is rejected.
17. Chi-square, non-directional, p ≤ 0.10, df = 27, χ² = 45.78
At the 10% significance level, the critical value for df = 27 is 36.74.
Since the observed value of χ² is 45.78, which is greater than the critical value, the alternative hypothesis is accepted, and the null hypothesis is rejected.
18. Spearman’s rho, directional, p ≤ 0.05, N = 19, r = 0.39
At the 5% level of significance, the critical value for a one-tailed test when N = 19 is 0.391.
Since the observed value of r is 0.39, which is less than the critical value, the alternative hypothesis is rejected, and the null hypothesis is accepted.
19. Mann–Whitney U, non-directional, p ≤ 0.10, N1 = 12, N2 = 13, U = 39
At the 10% level of significance, the critical value for a two-tailed test is 47.
Since the observed value of U is 39, which is less than the critical value, the experimental hypothesis is accepted, and the null hypothesis is rejected.
20. Chi-square, non-directional, p ≤ 0.05, df = 14, χ² = 18.17
At the 5% significance level, the critical value for df = 14 is 23.68.
Since the observed value of χ² is 18.17, which is less than the critical value, the alternative hypothesis is rejected, and the null hypothesis is accepted.
21. Spearman’s rho, directional, p ≤ 0.05, N = 11, r = 0.421
At the 5% level of significance, the critical value for a one-tailed Spearman’s rho test, when N = 11, is 0.536.
Since the observed value of r = 0.421, which is less than the critical value, the alternative hypothesis is rejected, and the null hypothesis is accepted.
22. Unrelated t-test, directional hypothesis at p ≤ 0.05, df = 22, t = 1.65
At the 5% level of significance, the critical value for a one-tailed test when df = 22 is 1.72. Since the observed value of t is 1.65, which is less than the critical value, the alternative hypothesis is rejected, and the null hypothesis is accepted.
23. Unrelated t-test, non-directional hypothesis at p ≤ 0.10, df = 28, t = 1.55
At the 10% level of significance, the critical value for a two-tailed test when df = 28 is 1.70. Since the observed value of t is 1.55, which is less than the critical value, the alternative hypothesis is rejected, and the null hypothesis is accepted.
24. Related t-test, directional hypothesis at p ≤ 0.05, df = 11, t = 2.05
At the 5% level of significance, the critical value for a one-tailed test when df = 11 is 1.80. Since the observed value of t is 2.05, which is greater than the critical value, the alternative hypothesis is accepted, and the null hypothesis is rejected.
25. Related t-test, non-directional hypothesis at p ≤ 0.05, df = 15, t = 1.80
At the 5% level of significance, the critical value for a two-tailed test when df = 15 is 2.13. Since the observed value of t is 1.80, which is less than the critical value, the alternative hypothesis is rejected, and the null hypothesis is accepted.
26. Related t-test, directional hypothesis at p ≤ 0.10, df = 19, t = 1.42
At the 10% level of significance, the critical value for a one-tailed test when df = 19 is 1.33. Since the observed value of t is 1.42, which is greater than the critical value, the alternative hypothesis is accepted, and the null hypothesis is rejected.
27. Pearson’s product-moment correlation, non-directional hypothesis at p ≤ 0.05, df = 10, r = 0.61
At the 5% level of significance, the critical value for a two-tailed test when df = 10 is 0.576. Since the observed value of r is 0.61, which is greater than the critical value, the alternative hypothesis is accepted, and the null hypothesis is rejected.
28. Pearson’s product-moment correlation, directional hypothesis at p ≤ 0.05, df = 18, r = 0.42
At the 5% level of significance, the critical value for a one-tailed test when df = 18 is 0.378. Since the observed value of r is 0.42, which is greater than the critical value, the alternative hypothesis is accepted, and the null hypothesis is rejected.
29. Pearson’s product-moment correlation, non-directional hypothesis at p ≤ 0.10, df = 28, r = 0.31
At the 10% level of significance, the critical value for a two-tailed test when df = 28 is 0.306. Since the observed value of r is 0.31, which is greater than the critical value, the alternative hypothesis is accepted, and the null hypothesis is rejected.
30. Pearson’s product-moment correlation, directional hypothesis at p ≤ 0.01, df = 12, r = 0.70
At the 1% level of significance, the critical value for a one-tailed test when df = 12 is 0.661. Since the observed value of r is 0.70, which is greater than the critical value, the alternative hypothesis is accepted, and the null hypothesis is rejected
EXAMIINER STYLE WRITE UP EXAMPLE
The critical value of T for N = 20 for a one-tailed test where p ≤ 0.05 is 60. As the observed value of T (29.5) is less than the critical value, the results are statistically significant. Therefore, the null hypothesis is rejected, and the experimental hypothesis is accepted
INFERENTIAL TESTS FOR TESTS OF ASSOCIATION
LET’S LOOK AT AN EXAMPLE EXAMINATION QUESTION
“A psychologist was interested in the effects of a restricted diet on memory functioning, and he expected memory to become impaired. The psychologist hypothesised that participants’ scores on a memory test would be lower after a restricted diet than before a restricted diet. He gave the volunteers a memory test when they first arrived in the research unit and a similar test at the end of the four weeks. He recorded the memory scores on both tests and analysed them using the Wilcoxon signed-rank test.” The test was out of 100
The psychologist set the significance level at 5%.
The calculated value was T = 53.
N= 20
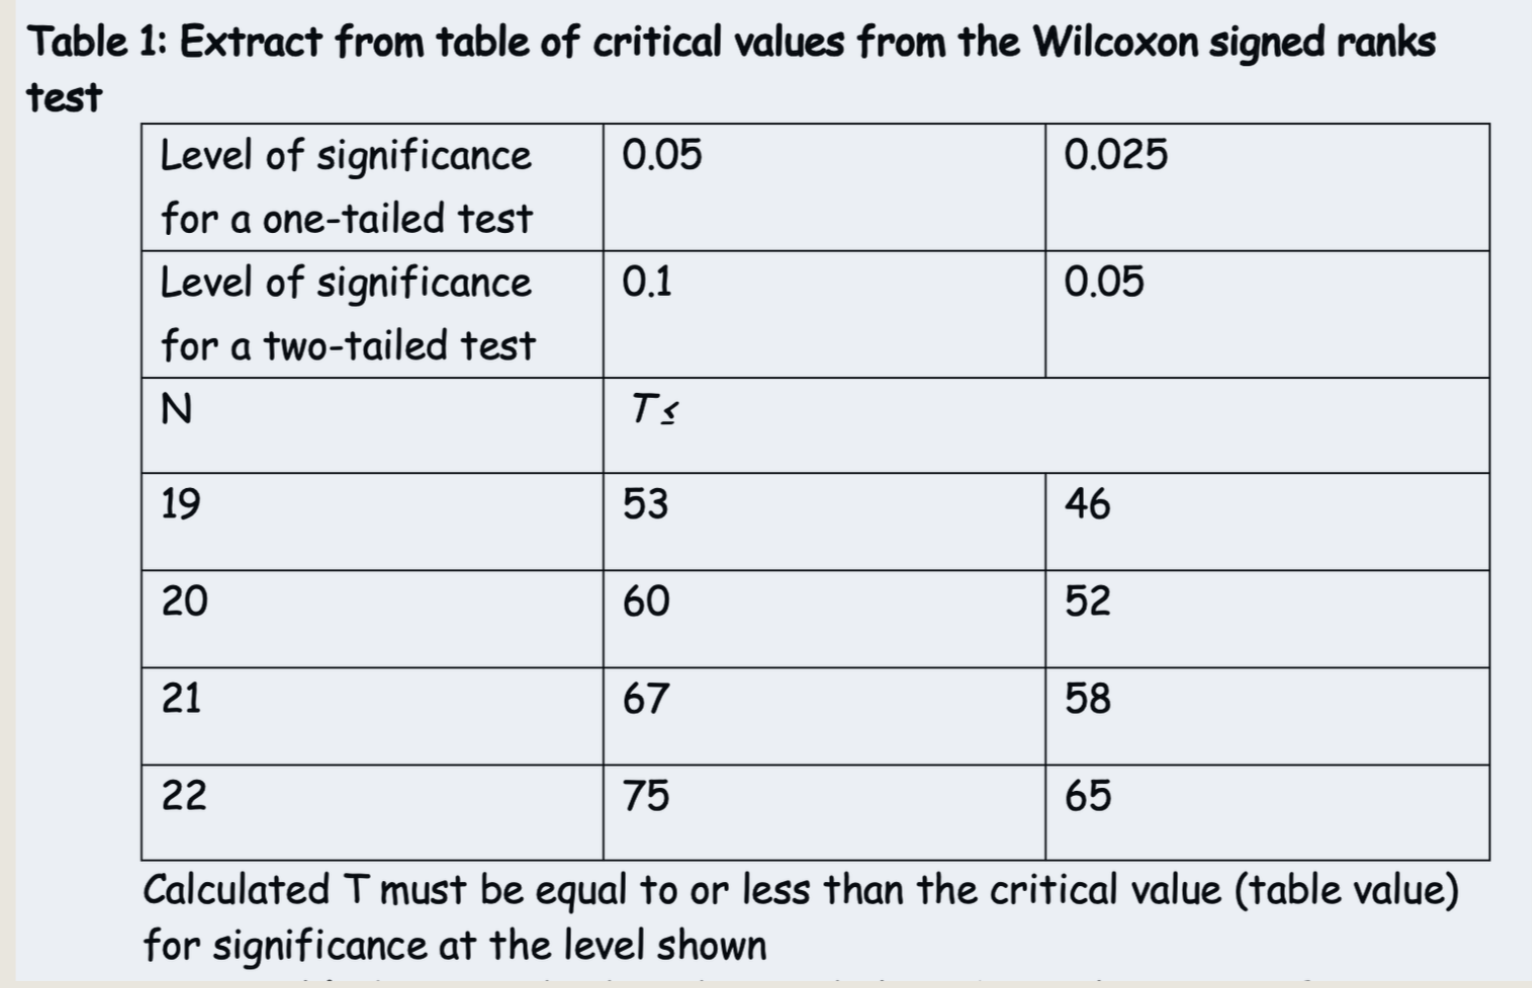
Q1: State whether the hypothesis for this study is directional or non-directional. (1 mark)
Q2: Using Table 1, state whether the psychologist’s result was significant. (3 Mark)
Q3: Explain your answer. (2 marks).
Q4: Name a statistical test appropriate for this investigation and give three reasons why it was appropriate to use this statistical test (4 Marks).
ANSWERS
Q1.Directional/one-tailed: as the psychologist specified, the results should follow a direction/tail, e.g., participants in the non-restricted food condition should get better scores on a memory test. One mark for correct answer – directional (one-tailed is acceptable)
Q2. Yes, the psychologist’s result was significant. One mark for correctly stating that the result is significant.(1 mark)
Q3: The critical value of T for N =20 for a one-tailed test where p ≤=0.05 is 60. As the observed/calculated value of T (53) is less than the critical/table value, the likelihood of my results occurring by chance is less than 5% (p ≤ 0.05). Therefore, I can reject my Null hypothesis and accept my experimental hypothesis. (Two marks)
Two further marks for an explanation: the calculated value of T =53 is less than the critical value of 60, where N = 20 and p ≤ 0.05 for a one-tailed test.
If the candidate states that the result is insignificant, no marks can be awarded.
Q4. A Wilcoxon matched-pairs test was chosen because a difference test was needed, the experimental design was repeated measures, and the data were interval, as the differences between memories are mathematical.
To score points on the questions above, it's essential to cover four to five key elements as specified:
The name of the test
The type of test, such as difference, association, or correlation
The experimental design, if applicable
The level of measurement
The rationale for the chosen level of measurement
SECTION M: QUESTIONS ON RESEARCH DESIGN
For each study, answer the questions below in order.
1. IS IT AN EXPERIMENT? (YES OR NO)
If NO, go to Question 2.
a) What type of experiment is it: laboratory, field, quasi, or natural
b) What experimental design is used: repeated measures, independent groups, or matched pairs
c) What are the IV and DV
d) What level of measurement are the data
e) What statistical test is required
f) Is the hypothesis directional (one-tailed) or non-directional (two-tailed)
If it is not obvious, suggest a direction
g) Suggest a suitable significance level
h) What value is needed to find the critical value: N, N1 and N2, or df
i) Write an aim
j) Write a hypothesis
2. IS IT A CORRELATION (NON-EXPERIMENT)? (YES OR NO)
If NO, go to Question 3.
a) What are the co-variables
b) Is the hypothesis directional (one-tailed) or non-directional (two-tailed)
If it is not obvious, suggest a direction
If directional, state whether it is positive or negative
c) Suggest a suitable significance level
d) What level of measurement are the data
e) What statistical test is required
f) What value is needed to find the critical value: N, N1 and N2, or df
g) Write an aim
h) Write a hypothesis
3. IS IT A NON-EXPERIMENT? (YES OR NO)
If NO, reconsider your earlier answers.
a) What type of non-experiment is it: natural observation, controlled observation, questionnaire or survey, content analysis, or case study
b) What are the variables
c) What level of measurement are the data
d) Is the hypothesis directional (one-tailed) or non-directional (two-tailed)
If it is not obvious, suggest a direction
e) Suggest a suitable significance level
f) What statistical test is required
g) What value is needed to find the critical value: N, N1 and N2, or df
h) Write an aim
i) Write a hypothesis
RESEARCH SCENARIOS
Researchers want to replicate a study examining differences between male and female estimates of stopping distance.
Ainsworth’s Strange Situation involved observers having behavioural categories to observe and tick each time they observed a behaviour.
Researchers believe that siblings’ aggression levels will have a similar relationship. Siblings are each given a rating scale to measure aggression, for example: “On a scale of 1 to 10, how aggressive are you?”
Researchers analyse “Lonely Heart” advertisements to investigate sexual selection theory. They hypothesise that male participants will advertise “status” more frequently than female participants and that female participants will advertise “looks” more frequently than male participants.
In a company, disabled and able-bodied participants are asked to indicate on a scale of 1 to 7 how much they feel in control of their working environment.
Identical twins are split into condition A, which sets a puzzle they can solve, or condition B, which sets an unsolvable puzzle. After thirty minutes in either condition, their stress level is measured with a rating scale, for example: “On a scale of 1 to 5, how stressed are you?” It is thought that participants who can solve the puzzle will be less stressed.
One group of participants is given an IQ test, then asked to take multivitamins for a month, and their IQ is measured again. It is thought that participants who take multivitamins will have higher IQ scores.
Researchers want to determine whether there is a difference in the happiness ratings of academic and non-academic pupils.
Researchers are investigating the effect of memory on age. They want to see if those aged 20 to 40 have poorer memories than those aged 40 to 60, so they administer a digit span memory test to both groups.
It is hypothesised that listening to music with aggressive lyrics increases heart rate. Participants listen to either music with aggressive lyrics or non-aggressive lyrics whilst their heart rate is measured.
It is hypothesised that caffeine causes memory problems. Scores on a memory test are taken before and after taking caffeine pills.
It is hypothesised that high levels of testosterone increase risk-taking. As finger length ratios are used as an indirect marker of prenatal testosterone exposure, the ratio between the second and fourth digits (2D:4D) of male participants’ fingers is measured and compared with risk-taking scores on a questionnaire.
How many units of alcohol per week are consumed by males and females?
Pictures of married couples are taken. Female participants rate the attractiveness of the male spouse, and male participants rate the attractiveness of the female spouse. It is thought that couples will have similar levels of attractiveness.
Female and male participants are asked to choose which female body shape they prefer, sizes 6, 8, 10, 12, 14, 16, 18, or 20. The sizes are exact.
Participants from Western and non-Western societies are asked to complete the Social Readjustment Rating Scale (SRRS, Holmes and Rahe) and calculate their scores.
School students are observed choosing snacks during breaks. The snack choices are either apples or crisps. The next morning, during school assembly, the same students are given the nutritional value of apples vs. crisps. They are then observed again to see whether they choose apples or crisps at break time.
A researcher wants to see if older siblings are more intelligent than younger siblings. All siblings complete an IQ test.
Children living in homes without gardens and those living in homes with private gardens are observed to see whether they choose to play outside in the street or stay at home.
Participants are either put in a jogging or non-jogging condition or asked to rate pictures of the opposite sex on a scale of 1 to 10. This is new research.
Research suggests that the antioxidants in foods such as blueberries can reduce age-related declines in cognitive functioning. To test this, a researcher selects 25 adults and administers a cognitive function test to each participant. The participants then drink a blueberry supplement daily for four months before they are tested again.
To examine the connection between alcohol consumption and birth weight, a researcher selects a sample of 20 pregnant rats and mixes alcohol with their food for two weeks before the pups are born. Another group of 20 pregnant rats is used as a comparison group.
To examine how texting affects driving skills, a researcher sets up a driving circuit using orange traffic cones in a parking lot. A group of students is then tested on the circuit twice: once while sending and receiving text messages, and once without sending or receiving text messages. The researcher records the number of cones hit on each circuit while driving for each student.
The more people exercise, the lower their blood pressure.
A statistics instructor believes that doing homework improves exam scores. To test this hypothesis, she randomly assigns students to two groups. One group must work on the homework until all problems are correct, while the second group's homework is optional. Exam grades are compared between the two groups at the end of the semester.
Researchers are investigating the effect of memory on age. They want to see if older children have poorer memories than younger children, so they administer a memory test to both groups
ANSWERS SECTION M: QUESTIONS ON RESEARCH DESIGN
1. Male vs female stopping distance estimates
Is the research an experiment or a non-experiment? Experiment.
What is the research method? Quasi-experiment.
What is the experimental design? Independent groups.
What are the IV and DV? IV: gender (male vs female). DV: stopping distance estimate.
What type of hypothesis is it: directional or non-directional? Non-directional.
Test of difference, association or correlation? Difference.
What inferential test is needed? Unrelated t-test.
What value is needed to find the critical value? df.
Aim: To investigate whether stopping distance estimates differ between males and females.
Hypothesis: There will be a difference in stopping distance estimates between males and females.
2. Ainsworth Strange Situation behavioural categories
Is the research an experiment or a non-experiment? Non-experiment.
What is the research method? Controlled observation.
What are the variables? Attachment classification and behaviour category frequency.
What type of hypothesis is it: directional or non-directional? Non-directional.
Test of difference, association or correlation? Association.
What inferential test is needed? Chi-square.
What value is needed to find the critical value? df.
Aim: To investigate whether observed attachment-related behaviours differ across attachment classifications.
Hypothesis: There will be an association between attachment classification and observed behaviour categories.
3. Sibling aggression (intra-class correlation)
Is the research an experiment or a non-experiment? Non-experiment.
What is the research method? Intra-class correlation.
What are the co-variables? Sibling A aggression rating and Sibling B aggression rating.
What type of hypothesis is it: directional or non-directional? Non-directional.
Test of difference, association or correlation? Correlation.
What inferential test is needed? Spearman’s rho.
What value is needed to find the critical value? N.
Aim: To investigate whether siblings’ aggression ratings are related.
Hypothesis: There will be a correlation between Sibling A aggression rating and Sibling B aggression rating.
4. Lonely Hearts adverts: status vs looks by gender
Is the research an experiment or a non-experiment? Non-experiment.
What is the research method? Content analysis.
What are the variables? Gender and advertised trait (status vs looks).
What type of hypothesis is it: directional or non-directional? Directional.
Test of difference, association or correlation? Association.
What inferential test is needed? Chi-square.
What value is needed to find the critical value? df.
Aim: To investigate whether advertised traits differ by gender in lonely hearts adverts.
Hypothesis: Males will advertise status more frequently than females, and females will advertise looks more frequently than males.
5. Disabled vs able bodied control rating (1 to 7)
Is the research an experiment or a non-experiment? Experiment.
What is the research method? Quasi-experiment.
What is the experimental design? Independent groups.
What are the IV and DV? IV: disability status (disabled vs able bodied). DV: control rating.
What type of hypothesis is it: directional or non-directional? Non-directional.
Test of difference, association or correlation? Difference.
What inferential test is needed? Mann-Whitney U.
What value is needed to find the critical value? N1 and N2.
Aim: To investigate whether perceived control differs between disabled and able-bodied participants.
Hypothesis: There will be a difference in perceived control ratings between disabled and able-bodied participants.
6. Solvable vs unsolvable puzzle, stress rating 1 to 5
Is the research an experiment or a non-experiment? Experiment.
What is the research method? Laboratory experiment.
What is the experimental design? Independent groups.
What are the IV and DV? IV: puzzle type (solvable vs unsolvable). DV: stress rating.
What type of hypothesis is it: directional or non-directional? Directional.
Test of difference, association or correlation? Difference.
What inferential test is needed? Mann-Whitney U.
What value is needed to find the critical value? N1 and N2.
Aim: To investigate whether puzzle solvability affects stress ratings.
Hypothesis: Participants given an unsolvable puzzle will report higher stress than participants given a solvable puzzle.
7. IQ before and after multivitamins
Is the research an experiment or a non-experiment? Experiment.
What is the research method? Laboratory experiment.
What is the experimental design? Repeated measures.
What are the IV and DV? IV: time (before vs after multivitamins). DV: IQ score.
What type of hypothesis is it: directional or non-directional? Directional.
Test of difference, association or correlation? Difference.
What inferential test is needed? Related t-test.
What value is needed to find the critical value? df.
Aim: To investigate whether multivitamin use changes IQ scores.
Hypothesis: IQ scores will be higher after one month of multivitamin use than before.
8. Academic vs non academic pupils’ happiness ratings
Is the research an experiment or a non-experiment? Experiment.
What is the research method? Quasi-experiment.
What is the experimental design? Independent groups.
What are the IV and DV? IV: pupil type (academic vs non-academic). DV: happiness rating.
What type of hypothesis is it: directional or non-directional? Non-directional.
Test of difference, association or correlation? Difference.
What inferential test is needed? Mann-Whitney U.
What value is needed to find the critical value? N1 and N2.
Aim: To investigate whether happiness ratings differ between academic and non-academic pupils.
Hypothesis: There will be a difference in happiness ratings between academic and non-academic pupils.
9. Age group and digit span memory test (20 to 40 vs 40 to 60)
Is the research an experiment or a non-experiment? Experiment.
What is the research method? Quasi-experiment.
What is the experimental design? Independent groups.
What are the IV and DV? IV: age group (20 to 40 vs 40 to 60). DV: digit span score.
What type of hypothesis is it: directional or non-directional? Directional.
Test of difference, association or correlation? Difference.
What inferential test is needed? Unrelated t-test.
What value is needed to find the critical value? df.
Aim: To investigate whether digit span memory differs between younger and older adults.
Hypothesis: Participants aged 40 to 60 will have lower digit span scores than participants aged 20 to 40.
10. Aggressive vs non aggressive lyrics, heart rate
Is the research an experiment or a non-experiment? Experiment.
What is the research method? Laboratory experiment.
What is the experimental design? Independent groups.
What are the IV and DV? IV: lyric type (aggressive vs non-aggressive). DV: heart rate.
What type of hypothesis is it: directional or non-directional? Directional.
Test of difference, association or correlation? Difference.
What inferential test is needed? Unrelated t-test.
What value is needed to find the critical value? df.
Aim: To investigate whether aggressive lyrics increase heart rate.
Hypothesis: Participants listening to aggressive lyrics will have a higher heart rate than those listening to non-aggressive lyrics.
11. Memory test before and after caffeine pills
Is the research an experiment or a non-experiment? Experiment.
What is the research method? Laboratory experiment.
What is the experimental design? Repeated measures.
What are the IV and DV? IV: caffeine condition (before vs after caffeine). DV: memory test score.
What type of hypothesis is it: directional or non-directional? Directional.
Test of difference, association or correlation? Difference.
What inferential test is needed? Related t-test.
What value is needed to find the critical value? df.
Aim: To investigate whether caffeine affects memory test performance.
Hypothesis: Memory test scores will be lower after consuming caffeine pills than before.
12. Finger ratio (2D:4D) and risk-taking score
Is the research an experiment or a non-experiment? Non-experiment.
What is the research method? Correlation.
What are the co-variables? 2D:4D ratio and risk-taking score.
What type of hypothesis is it: directional or non-directional? Directional.
Test of difference, association or correlation? Correlation.
What inferential test is needed? Pearson’s correlation.
What value is needed to find the critical value? N.
Aim: To investigate whether the 2D:4D ratio is related to risk-taking.
Hypothesis: There will be a correlation between the 2D:4D ratio and risk-taking score.
13. Units of alcohol per week: males vs females
Is the research an experiment or a non-experiment? Experiment.
What is the research method? Quasi-experiment.
What is the experimental design? Independent groups.
What are the IV and DV? IV: gender (male vs female). DV: units of alcohol per week.
What type of hypothesis is it: directional or non-directional? Non-directional.
Test of difference, association or correlation? Difference.
What inferential test is needed? Unrelated t-test.
What value is needed to find the critical value? df.
Aim: To investigate whether alcohol consumption differs between males and females.
Hypothesis: There will be a difference in units of alcohol consumed per week between males and females.
14. Couples’ attractiveness ratings: male rates female, female rates male
Is the research an experiment or a non-experiment? Non-experiment.
What is the research method? Correlation.
What are the co-variables? Male partner attractiveness rating and female partner attractiveness rating.
What type of hypothesis is it: directional or non-directional? Non-directional.
Test of difference, association or correlation? Correlation.
What inferential test is needed? Spearman’s rho.
What value is needed to find the critical value? N.
Aim: To investigate whether attractiveness ratings within couples are related.
Hypothesis: There will be a correlation between male and female partner attractiveness ratings.
15. Body shape preference (sizes 6 to 20) male vs female
Is the research an experiment or a non-experiment? Experiment.
What is the research method? Quasi-experiment.
What is the experimental design? Independent groups.
What are the IV and DV? IV: gender (male vs female). DV: preferred body size.
What type of hypothesis is it: directional or non-directional? Non-directional.
Test of difference, association or correlation? Difference.
What inferential test is needed? Unrelated t-test.
What value is needed to find the critical value? df.
Aim: To investigate whether preferred female body size differs between males and females.
Hypothesis: There will be a difference in preferred female body size between males and females.
16. Western vs non Western SRRS scores
Is the research an experiment or a non-experiment? Experiment.
What is the research method? Quasi-experiment.
What is the experimental design? Independent groups.
What are the IV and DV? IV: culture (Western vs non-Western). DV: SRRS score.
What type of hypothesis is it: directional or non-directional? Non-directional.
Test of difference, association or correlation? Difference.
What inferential test is needed? Unrelated t-test.
What value is needed to find the critical value? df.
Aim: To investigate whether SRRS scores differ between Western and non-Western participants.
Hypothesis: There will be a difference in SRRS scores between Western and non-Western participants.
17. Snack choice before and after nutritional information (apples vs crisps)
Is the research an experiment or a non-experiment? Experiment.
What is the research method? Field experiment.
What is the experimental design? Repeated measures.
What are the IV and DV? IV: time (before vs after nutritional information). DV: snack choice (apple vs crisps).
What type of hypothesis is it: directional or non-directional? Directional.
Test of difference, association or correlation? Difference.
What inferential test is needed? Sign test.
What value is needed to find the critical value? N.
Aim: To investigate whether nutritional information changes snack choice.
Hypothesis: More students will choose apples after receiving nutritional information than before.
18. Older vs younger siblings’ IQ
Is the research an experiment or a non-experiment? Non-experiment.
What is the research method? Correlation.
What are the co-variables? Older sibling IQ and younger sibling IQ.
What type of hypothesis is it: directional or non-directional? Non-directional.
Test of difference, association or correlation? Correlation.
What inferential test is needed? Pearson’s correlation.
What value is needed to find the critical value? N.
Aim: To investigate whether older and younger siblings’ IQ scores are related.
Hypothesis: There will be a correlation between older sibling IQ and younger sibling IQ.
19. Garden vs no garden, play outside vs stay at home
Is the research an experiment or a non-experiment? Non-experiment.
What is the research method? Naturalistic observation.
What are the variables? Garden access (yes vs no) and play location (outside vs at home).
What type of hypothesis is it: directional or non-directional? Non-directional.
Test of difference, association or correlation? Association.
What inferential test is needed? Chi-square.
What value is needed to find the critical value? df.
Aim: To investigate whether garden access is associated with play location.
Hypothesis: There will be an association between garden access and children's outdoor play.
20. Jogging vs no jogging, attractiveness ratings 1 to 10
Is the research an experiment or a non-experiment? Experiment.
What is the research method? Laboratory experiment.
What is the experimental design? Independent groups.
What are the IV and DV? IV: condition (jogging vs no jogging). DV: attractiveness rating.
What type of hypothesis is it: directional or non-directional? Non-directional.
Test of difference, association or correlation? Difference.
What inferential test is needed? Mann-Whitney U.
What value is needed to find the critical value? N1 and N2.
Aim: To investigate whether jogging affects attractiveness ratings.
Hypothesis: There will be a difference in attractiveness ratings between participants in the jogging and non-jogging conditions.
21. Blueberry supplement and cognition test (before vs after)
Is the research an experiment or a non-experiment? Experiment.
What is the research method? Laboratory experiment.
What is the experimental design? Repeated measures.
What are the IV and DV? IV: time (before vs after supplement). DV: cognition test score.
What type of hypothesis is it: directional or non-directional? Directional.
Test of difference, association or correlation? Difference.
What inferential test is needed? Related t-test.
What value is needed to find the critical value? df.
Aim: To investigate whether a blueberry supplement improves cognitive test scores.
Hypothesis: Cognitive test scores will be higher after four months of blueberry supplementation than before.
22. Pregnant rats, alcohol vs control, pup birth weight
Is the research an experiment or a non-experiment? Experiment.
What is the research method? Laboratory experiment.
What is the experimental design? Independent groups.
What are the IV and DV? IV: alcohol exposure (alcohol vs control). DV: pup birth weight.
What type of hypothesis is it: directional or non-directional? Directional.
Test of difference, association or correlation? Difference.
What inferential test is needed? Unrelated t-test.
What value is needed to find the critical value? df.
Aim: To investigate whether maternal alcohol consumption affects pup birth weight.
Hypothesis: Pups born to alcohol exposed mothers will have a lower birth weight than pups born to control mothers.
23. Texting vs no texting while driving, cones hit
Is the research an experiment or a non-experiment? Experiment.
What is the research method? Laboratory experiment.
What is the experimental design? Repeated measures.
What are the IV and DV? IV: condition (texting vs no texting). DV: cones hit.
What type of hypothesis is it: directional or non-directional? Directional.
Test of difference, association or correlation? Difference.
What inferential test is needed? Related t-test.
What value is needed to find the critical value? df.
Aim: To investigate whether texting increases driving errors measured by cones hit.
Hypothesis: Participants will hit more cones while texting than when not texting.
24. Exercise frequency and blood pressure
Is the research an experiment or a non-experiment? Non-experiment.
What is the research method? Correlation.
What are the co-variables? Exercise frequency and blood pressure.
What type of hypothesis is it: directional or non-directional? Directional.
Test of difference, association or correlation? Correlation.
What inferential test is needed? Pearson’s correlation.
What value is needed to find the critical value? N.
Aim: To investigate whether exercise frequency is related to blood pressure.
Hypothesis: There will be a negative correlation between exercise frequency and blood pressure.
25. Compulsory homework vs optional homework, exam scores
Is the research an experiment or a non-experiment? Experiment.
What is the research method? Laboratory experiment.
What is the experimental design? Independent groups.
What are the IV and DV? IV: homework condition (compulsory vs optional). DV: exam score.
What type of hypothesis is it: directional or non-directional? Directional.
Test of difference, association or correlation? Difference.
What inferential test is needed? Unrelated t-test.
What value is needed to find the critical value? df.
Aim: To investigate whether compulsory homework improves exam scores.
Hypothesis: Students in the compulsory homework condition will achieve higher exam scores than students in the optional homework condition.
26. Age and memory performance (older vs younger children)
Is the research an experiment or a non-experiment? Experiment.
What is the research method? Quasi-experiment.
What is the experimental design? Independent groups.
What are the IV and DV? IV: age group (older vs younger). DV: memory test score.
What type of hypothesis is it: directional or non-directional? Directional.
Test of difference, association or correlation? Difference.
What inferential test is needed? Unrelated t-test.
What value is needed to find the critical value? df.
Aim: To investigate whether memory test performance differs between older and younger children.
Hypothesis: Older children will score lower on the memory test than younger children
SECTION N: ISSUES AND DEBATES
Identify four key ethical guidelines in psychological research. (4 marks)
Outline two alternatives to deceiving participants. (4 marks)
Define socially sensitive research. (4 marks)
Define ethnocentrism. (4 marks)
Define cultural relativism. (4 marks)
Define an etic approach. (4 marks)
Define imposed etic. (4 marks)
Define derived etic. (4 marks)
Define the emic approach. (4 marks)
Define alpha bias. (4 marks)
Define beta bias. (4 marks)
Define androcentric beta bias. (4 marks)
Define oestrogenic (gynocentric) beta bias. (2 marks)
Define free will. (4 marks)
Define soft determinism (compatibilism). (4 marks)
Define psychic determinism. (4 marks)
Define biological determinism. (4 marks)
Define environmental determinism. (4 marks)
Define the idiographic approach. (4 marks)
Define the nomothetic approach. (4 marks)
Explain falsifiability. (4 marks)
Explain deductive reasoning. (4 marks)
Explain inductive reasoning. (4 marks)
ANSWERS SECTION N: ISSUES, AND DEBATES
Identify four key ethical guidelines in psychological research. (4 marks)
Informed consent: participants must be provided with sufficient information about the aims, procedures, and potential risks of the research so that they can make an informed decision about participation.
Protection from harm: researchers must ensure that participants are not exposed to psychological or physical harm beyond that of everyday experience, including stress, embarrassment, or loss of self-esteem.
Confidentiality: personal data and results must be kept anonymous or confidential to prevent participants from being identified in reports or publications.
Right to withdraw: participants must be aware that they can withdraw from the study or withdraw their data at any time, without giving a reason and without penalty.
2. Outline two alternatives to deceiving participants. (4 marks)
Presumptive consent involves asking a similar group of people whether they would consent to the procedures used in the study. If they agree, the researcher assumes that the actual participants would also have consented, reducing the ethical impact of deception.
Prior general consent entails participants agreeing in advance to participate in research that may involve deception, without being told the specific details. This allows the study to proceed ethically while preserving the research’s validity.
3. Define socially sensitive research. (4 marks)
Socially sensitive research is psychological research that has the potential to affect individuals, groups, or society beyond the immediate research context. It may influence social attitudes, public policy, or the perception and treatment of particular groups. Such research can lead to positive outcomes, such as improved understanding or social reform, but also carries risks of stigma, discrimination, or misuse of findings. Ethical consideration is therefore essential at all stages of the research process.
4. Define ethnocentrism. (4 marks)
Ethnocentrism is the tendency to view, interpret, and evaluate other cultures using the norms, values, and standards of one’s own culture. In psychology, this often results in research findings from one cultural group being treated as universal. This can lead to biased theories and conclusions that misrepresent or devalue other cultures. Ethnocentrism reduces the validity and generalisability of psychological research.
5. Define cultural relativism. (4 marks)
Cultural relativism is the view that behaviour, beliefs, and research findings should be understood within the cultural context in which they occur. Rather than applying external standards, behaviour is interpreted according to the norms and values of that culture. In psychology, this approach aims to reduce cultural bias and improve validity. However, it can limit cross-cultural comparison and generalisation.
6. Define an etic approach. (4 marks)
An etic approach studies behaviour from outside a particular culture, using concepts and methods assumed to be universal. It seeks to identify behaviours or psychological processes that can be compared across cultures. This approach allows cross-cultural comparisons and the development of general theories. However, it risks cultural bias if culturally specific meanings are overlooked.
7. Define imposed etic. (4 marks)
An imposed etic occurs when psychological theories, concepts, or measures developed in one culture are applied to another culture without modification. It assumes that behaviours and constructs have the same meaning across cultures. This often reflects ethnocentrism and can lead to invalid or misleading conclusions. Imposed etics are a major source of cultural bias in psychology.
8. Define derived etic. (4 marks)
A derived etic is a genuinely universal concept that emerges from researchers' study of behaviour across multiple cultures using emic approaches. Findings are then compared to identify common underlying processes. Unlike imposed etics, derived etics are grounded in cross-cultural evidence. This approach balances cultural sensitivity with the aim of generalisation.
9. Define the emic approach. (4 marks)
The emic approach studies behaviour from within a specific culture, focusing on culture-specific meanings, values, and practices. Research methods and interpretations are tailored to the cultural context being studied. This increases ecological validity and reduces cultural bias. However, findings are often difficult to generalise to other cultures.
10. Define alpha bias. (4 marks)
Alpha bias refers to theories or research that exaggerate or overemphasise differences between groups, commonly between males and females. These differences are often portrayed as fixed or biologically determined. Alpha bias can reinforce stereotypes and justify unequal treatment. It contrasts with beta bias, which minimises or ignores differences.
11. Define beta bias. (4 marks)
Beta bias occurs when real differences between groups are minimised or ignored in psychological research. One group, typically males, is treated as the norm and findings are assumed to apply equally to all. This leads to theories that lack validity for underrepresented groups. Beta bias often results from androcentric research practices.
12. Define androcentric beta bias. (4 marks)
Androcentric beta bias occurs when male participants and male experiences dominate psychological research. Findings based on males are then generalised to females, treating male behaviour as the standard or norm. Female behaviour may be seen as a deviation from this norm rather than as different in its own right. This can distort the understanding of female psychology.
13. Define oestrogenic (gynocentric) beta bias. (4 marks)
Oestrogenic or gynocentric beta bias occurs when female behaviour or biological processes are treated as the norm and applied to males. Sex differences are minimised or ignored, particularly in areas such as emotional expression or caregiving. This can lead to inaccurate conclusions about male behaviour. It is less common than androcentric bias but still represents beta bias.
14. Define free will. (4 marks)
Free will is the idea that individuals have conscious awareness and control over their actions. Behaviour is seen as the result of deliberate choice rather than being fully determined by internal or external forces. This perspective assumes personal responsibility for behaviour. It contrasts with deterministic explanations in psychology.
15. Define soft determinism (compatibilism). (4 marks)
Soft determinism is the view that behaviour is influenced by biological, psychological, and environmental factors, but individuals still have some degree of choice. Behaviour is considered determined, yet voluntary, because choices are made without direct external coercion. This approach attempts to reconcile free will with determinism. It is widely accepted in modern psychology.
16. Define psychic determinism. (4 marks)
Psychic determinism is the view that behaviour is determined by unconscious psychological forces. According to this perspective, actions are shaped by repressed memories, unresolved conflicts, and early childhood experiences. Behaviour may appear accidental or freely chosen but is actually driven by unconscious motives. This concept is central to the psychodynamic approach.
17 Define biological determinism. (4 marks)
Biological determinism is the view that behaviour is primarily shaped by biological factors, such as genes, hormones, neurochemistry, and brain structure. It suggests that many behaviours are innate or genetically programmed. This approach emphasises nature over nurture. It can be criticised for underestimating environmental influences.
18 Define environmental determinism. (4 marks)
Environmental determinism is the view that behaviour is shaped by external factors such as learning, upbringing, social environment, and reinforcement. It assumes behaviour is largely the result of experience rather than biology. This perspective is associated with behaviourism and social learning theory. It may be criticised for neglecting biological influences.
19. Define the idiographic approach. (4 marks)
The idiographic approach focuses on the detailed study of individuals rather than large groups. It aims to understand unique experiences, personal meanings, and individual differences. Methods often include case studies and qualitative data. This approach contrasts with nomothetic approaches that seek general laws of behaviour.
20. The nomothetic approach focuses on studying large groups of people to identify general laws or principles of behaviour. It aims to produce findings that can be generalised across individuals. Research typically uses quantitative methods, experiments, and statistical analysis. This approach contrasts with the idiographic approach, which focuses on individual cases
21. Explain falsifiability. (4 marks)
Falsifiability refers to the principle that for a theory to be considered scientific, it must be testable and capable of being proven false. A falsifiable theory makes clear predictions that can be empirically tested, allowing evidence to either support or contradict it. If a theory cannot be disproved under any circumstances, it cannot be objectively evaluated and is therefore not scientific. This concept is important because it enables psychological theories to be challenged, refined, or rejected on the basis of evidence.
22. Explain deductive reasoning. (4 marks)
Deductive reasoning involves starting with a general theory and using it to generate specific, testable hypotheses. These hypotheses are tested through observation or experimentation. If the results support the hypothesis, the theory is strengthened; if not, the theory may be modified or rejected. Deductive reasoning, therefore, follows a theory → hypothesis → test → conclusion sequence and is central to the scientific method in psychology.
23. Explain inductive reasoning. (4 marks)
Inductive reasoning involves starting with observations or empirical data and using these to identify patterns or trends. From these observations, researchers develop a general theory or explanation. Unlike deductive reasoning, inductive reasoning does not begin with a theory but builds one from the evidence.