
GRAPHS, TABLES, SCATTERGRAMS, AND BAR CHARTS.
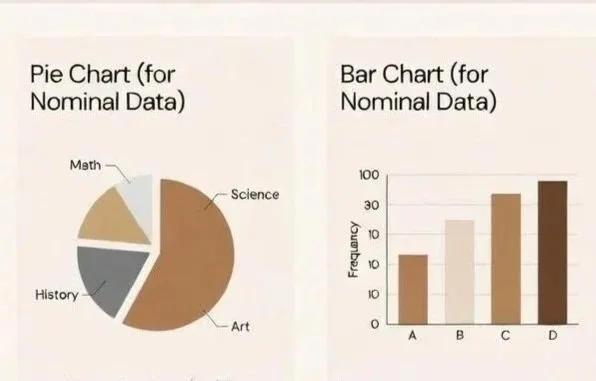
Presentation and display of quantitative data: graphs, tables, scattergrams, bar charts and histograms. Essential topic for A-level psychology data handling and analysis.
Presentation and display of quantitative data: graphs, tables, scattergrams, bar charts and histograms. Essential topic for A-level psychology data handling and analysis.